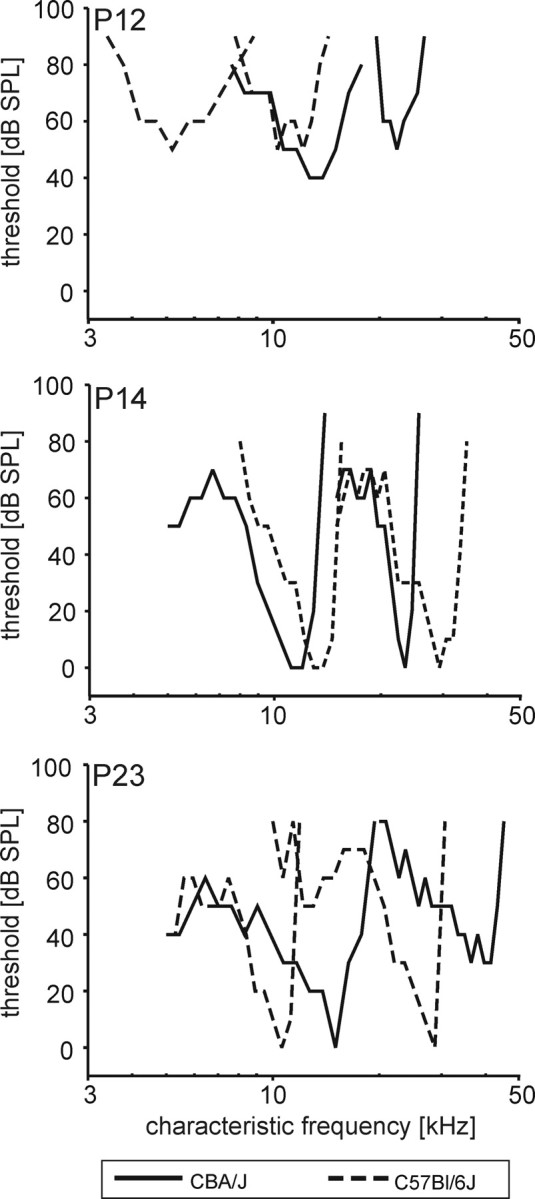
Figure 5.

Frequency-tuning curves at P12, P14, and P23. Representative frequency-tuning curves of two units for each mouse strain. At P12 units in both strains (CBA/J, solid lines; C57BL/6J, dashed lines) showed broad, symmetrical tuning curves and high thresholds. From P14 on, tuning curves typically displayed low-frequency tails, sharply tuned peaks, and low threshold values.
