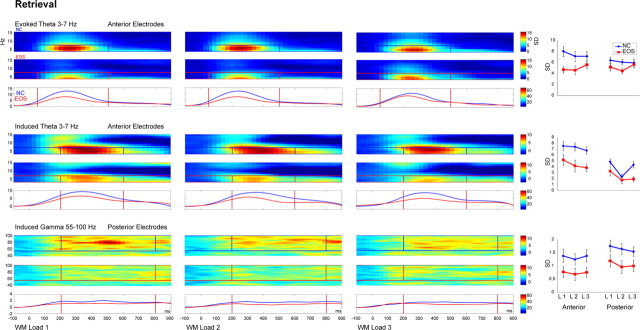
Figure 5.
Induced oscillatory activity during WM retrieval. Evoked (top) and induced (middle) theta activity at anterior electrodes and induced gamma activity (bottom) at posterior electrodes following the test stimulus for WM load 1 (left), WM load 2 (center), and WM load 3 (right) are shown for the retrieval period of 1 s for controls (NC, blue, top row) and patients with EOS (red, middle row) and the group comparison in the frequency range and time window of interest (bottom row). The frequency and latency range of interest are denoted in bars. On the far right, mean amplitudes in response to WM load 1, 2, or 3 are shown for the anterior and posterior ROI for patients (EOS, red) and controls (NC, blue). Error bars represent SE.

