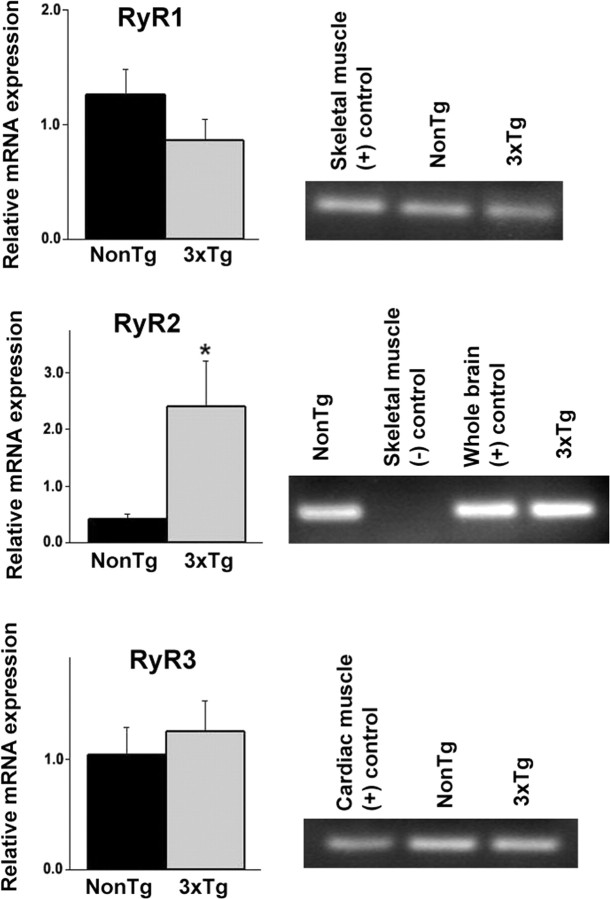
Figure 2.
Upregulation of the RyR2 isoform in 3xTg-AD hippocampus. Bar graphs show relative mRNA expression levels of RyR1 (top), RyR2 (middle), and RyR3 (bottom) isoforms from the hippocampus of NonTg (black) and 3xTg-AD (gray) mice. To the right of each graph are the PCR products detected on an agarose gel along with relevant positive and negative controls for each RyR isoform. mRNA levels are relative to control Cyclophilin A levels. *p < 0.05, significantly different from NonTg levels. Error bars represent ±SEM.

