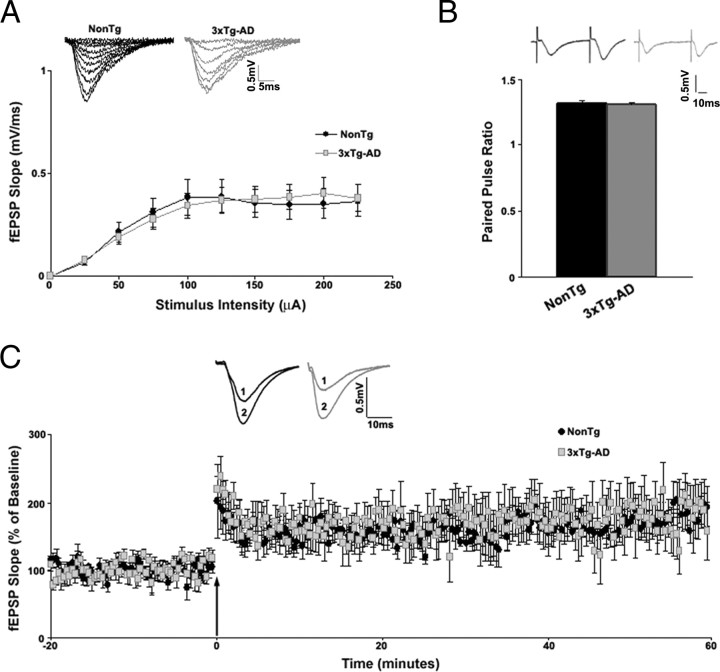
Figure 3.
Basal synaptic transmission properties of CA3–CA1 Schaffer collaterals recorded from 6- to 8-week-old NonTg and 3xTg-AD mice. A, Top, Representative I/O traces show changes in fEPSP amplitude with increasing stimulus intensity for NonTg (black) and 3xTg-AD (gray) mice. Bottom, I/O function shows changes in fEPSP slope with increasing stimulus intensity (0–225 μA) for NonTg (black circles; n = 15) and 3xTg-AD (gray squares; n = 25) mice. B, PPF was measured at an interstimulus interval of 50 ms. Top, Representative PPF traces from NonTg (black) and 3xTg-AD (gray) mice. Bottom, Bar graphs show paired pulse ratio for NonTg (black; n = 21) and 3xTg-AD (gray; n = 33) mice. C, Top, Representative fEPSP traces before (1) and after (2) induction of LTP from NonTg (black; n = 7) and 3xTg-AD (gray; n = 6) mice. Bottom, Graph shows averaged time course of LTP. Baseline fEPSPs were recorded for 20 min at 0.05 Hz before and for 60 min at 0.05 Hz after induction of LTP. The arrow indicates the time of tetanus (2 trains at 100 Hz, 10 s apart). Error bars represent ±SEM, and n denotes number of slices.

