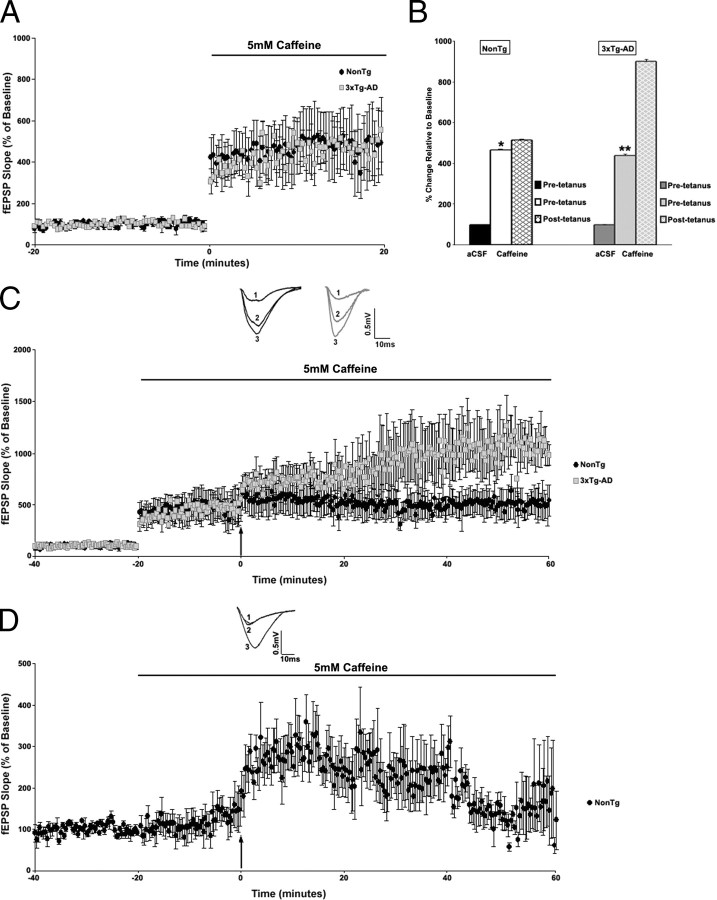
Figure 8.
Effect of activating RyR-mediated ER Ca2+ stores on LTP in NonTg and 3xTg-AD mice. A, Graph shows changes in baseline fEPSP slope from NonTg (black circles; n = 4) and 3xTg-AD (gray squares; n = 4) mice after treatment with 5 mm caffeine. B, Bar graph shows fEPSP slope of pretetanus (white and light gray, respectively) and posttetanus (black and gray hatched, respectively) baselines in presence of caffeine as percentage of precaffeine baseline (black and dark gray, respectively) in NonTg and 3xTg-AD mice. C, Top, Representative pretetanus fEPSP traces before (1) and after (2) treatment with caffeine and posttetanus fEPSP traces (3) with caffeine from NonTg (black) and 3xTg-AD (gray) mice. Bottom, Graph shows averaged time course of LTP with predrug baseline and pretetanic and posttetanic baseline with caffeine treatment from NonTg (black circles) and 3xTg-AD (gray squares) mice. D, Top, Representative pretetanus fEPSP traces before (1) and after (2) treatment with caffeine and posttetanus fEPSP traces (3) with caffeine from NonTg mice (black). Bottom, Graph shows averaged time course of LTP with predrug baseline and pretetanic and posttetanic baseline with caffeine treatment from NonTg mice (black circles; n = 4). Here, the stimulus intensity was adjusted so that the fEPSP size after caffeine treatment matched the precaffeine fEPSP size. The tetanus was applied at the readjusted stimulus intensity. The black arrow indicates the time of tetanus. * indicates significantly different from NonTg before caffeine treatment. ** indicates significantly different from 3xTg-AD before caffeine treatment. Error bars represent ±SEM, p < 0.05, and n denotes the number of slices.

