Figure 4.
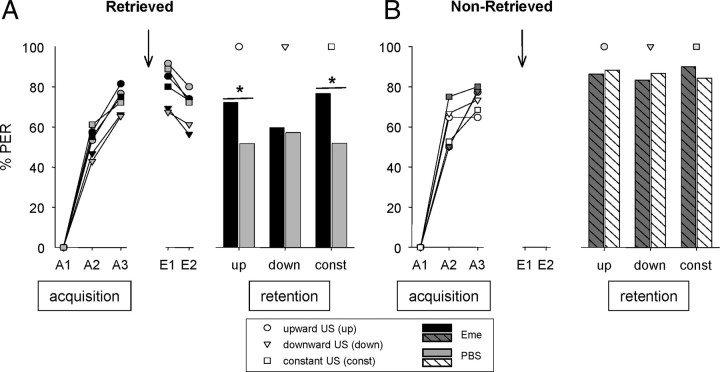
Differences in the consolidation of an extinction memory are not attributable to differences in satiation level. A, Retrieved. On day 1, animals were subjected to three CS–US pairings (A1–A3) with an increasing duration (upward 2 s, 6 s, 10 s; circles), a constant duration (constant 6 s; squares), or a decreasing duration (downward 10 s, 6 s, 2 s; triangles) of US presentations during training (acquisition). After 24 h, on day 2, emetine (black symbols) or PBS (gray symbols) was injected 30 min before two CS-only trials (E1, E2). On day 3, memory was tested (retention). Number of animals: up-Eme_R, n = 54; up-PBS_R, n = 60; const-Eme_R, n = 60; const-PBS_R, n = 54; down-Eme_R, n = 62; down-PBS_R: n = 49. B, Non-retrieved. On day 1, animals were subjected to three CS–US pairings (A1–A3) with an increasing duration (upward 2 s, 6 s, 10 s; circles), a constant duration (constant 6 s; squares), or a decreasing duration (downward 10 s, 6 s, 2 s; triangles) of US presentations during training (acquisition). After 24 h, on day 2, emetine (black symbols) or PBS (gray symbols) was injected. On day 3, memory was tested (retention). Number of animals: up-Eme, n = 22; up-PBS, n = 17; const-Eme, n = 20; const-PBS, n = 19; down-Eme, n = 18; down-PBS, n = 15. Presented are percentages of bees showing the CR to the CS at different phases of the experiment. Asterisk indicates significant differences (p < 0.05). Arrow, Time of injection.

