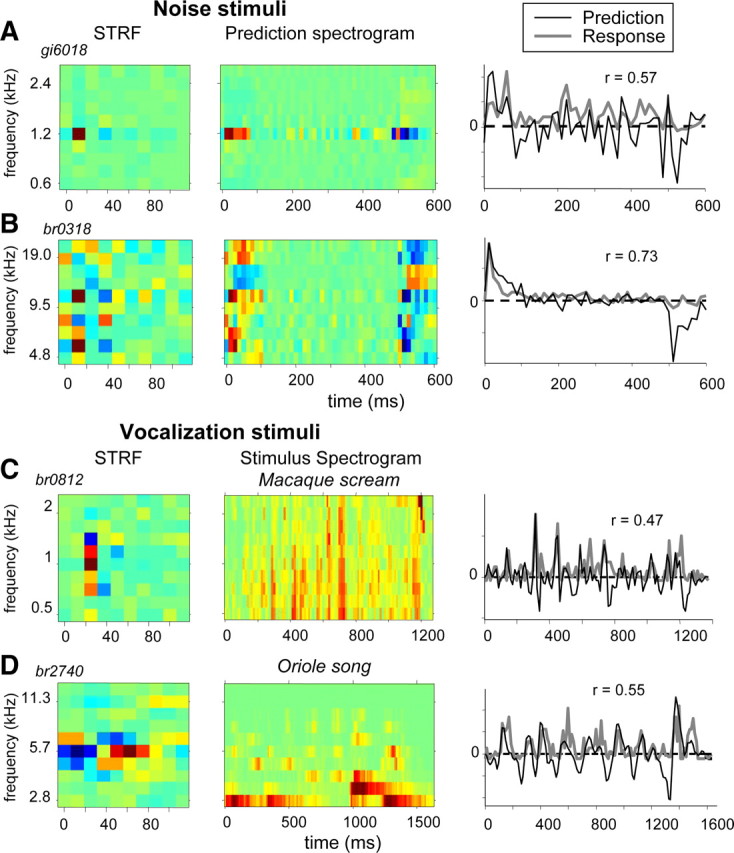
Figure 14.

Predictions of responses to noise stimuli or vocalizations according to Equation 9 compared with the actual responses for four different IC neurons. The left column shows the STRFs of the neuron, and the middle column shows either response spectrograms as in Figure 13B (A, B) or stimulus spectrograms (C, D), and the right column shows the predicted (black curve) and recorded (gray curve) responses. A, Neuron with low BF (1.2 kHz) responding to noise stimulus. B, Neuron with double-peak STRF (6 and 11 kHz). C, Neuron with low BF (1 kHz) responding to an undulating macaque scream. D, Neuron with medium-high BF (6 kHz) and inhibition preceding excitation responding to a bird song (northern oriole).
