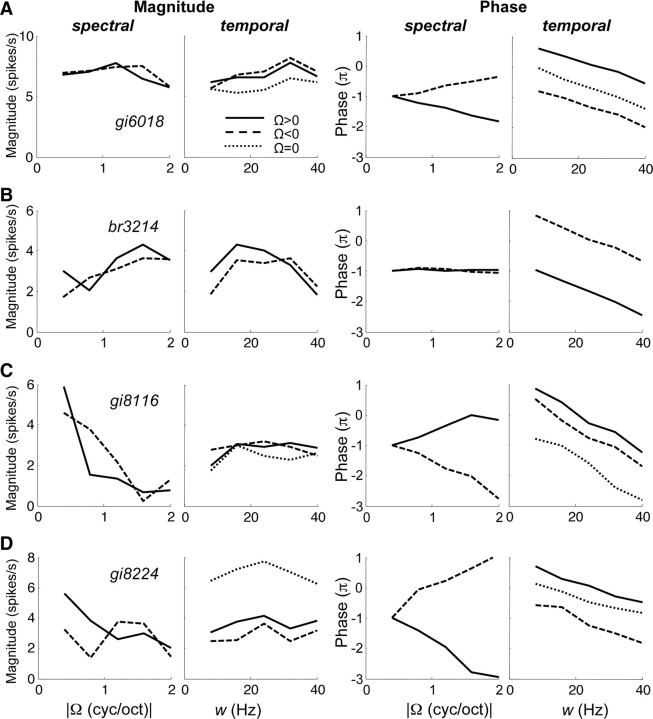
Figure 8.
Separated transfer functions of four different neurons: magnitude (spikes per seconds) and phase (radians) versus ripple density and ripple velocity. Solid curves represent functions for downward sweep direction (Ω > 0), and dashed curves represent functions for upward direction (Ω < 0). Dotted curves represent AM transfer functions (Ω = 0) for three cells that yielded significant responses (q50 > 0.376). Note that, for comparison purposes, the spectral data for Ω < 0 are shown along the positive Ω axis. Inseparability indices α were as follows, with αdown for downward, αup for upward sweep direction, and αtotal for total transfer function (downward, upward, and Ω = 0). A, αdown = 0.03; αup = 0.02; αtotal = 0.04. B, αdown = 0.08; αup = 0.08; αtotal = 0.13. C, αdown = 0.05; αup = 0.16; αtotal = 0.16. D, αdown = 0.14; αup = 0.34; αtotal = 0.18. The corresponding complete transfer functions are shown in Figures 2 and 3.

