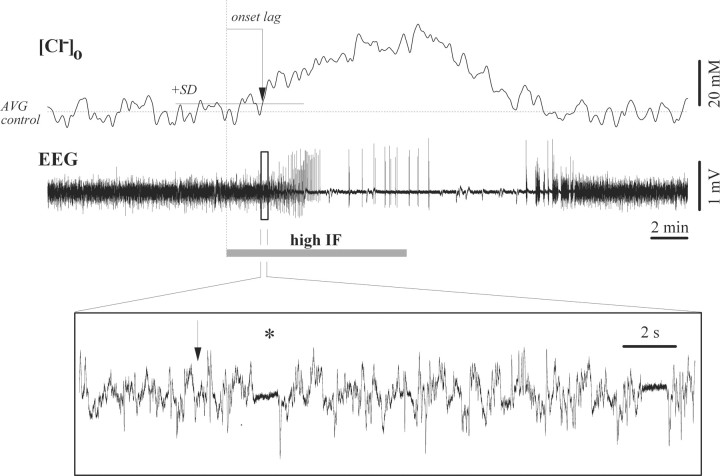
Figure 6.
Extracellular Cl− concentration ([Cl−]o) during BS induction and recovery. Note progressively increased Cl− values after application of increased (3%) isoflurane (high IF) and return to control values after the withdrawal of the additional dose. The dotted horizontal line indicates the average Cl− concentration under low isoflurane, while the continuous horizontal line represents the summation of the average and SD values. The time delay of the Cl− increase was determined as the first value crossing the SD line without subsequently returning (vertical arrow). The EEG period within the square is expanded below to show the appearance of the first isoelectric episode within seconds after the onset of the Cl− increase (vertical arrow).

