
Figure 3.
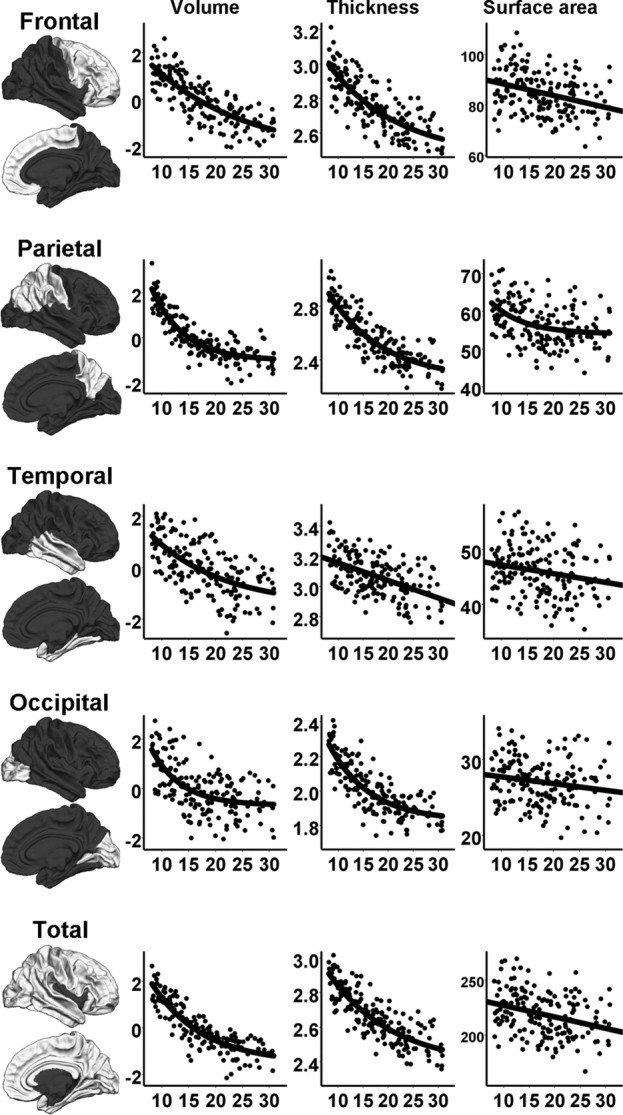
Regression plots showing the relationship between age and bilateral cortical volume (TBV corrected), thickness, and surface area for each cortical lobe and for the total cerebral cortex, with age on the horizontal axes. The measurements are standardized residuals (volumes), in millimeters (thickness), and in square millimeters (surface area) on the vertical axes. The parcellation of the cortical lobes are displayed in the left column.