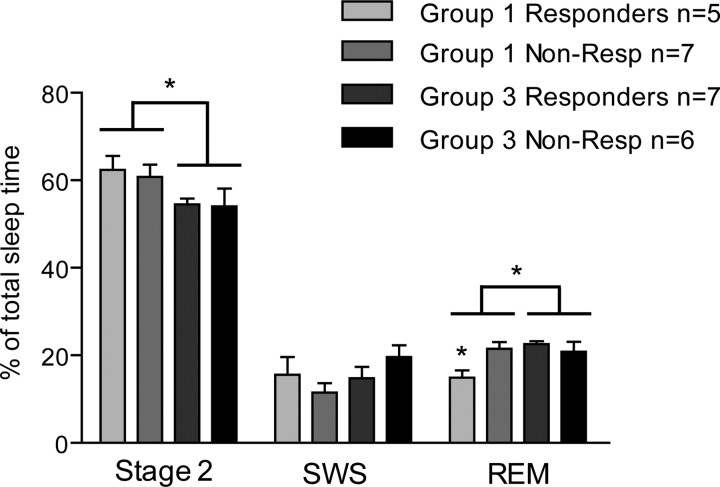
Figure 3.
Sleep architecture of placebo responders and nonresponders of groups 1 and 3. Subjects in group 1 displayed higher proportions of stage 2 sleep and smaller proportions of REM sleep. The reduction in REM sleep was specific to placebo responders in group 1. ANOVA, *p < 0.05. SWS, Slow-wave sleep.

