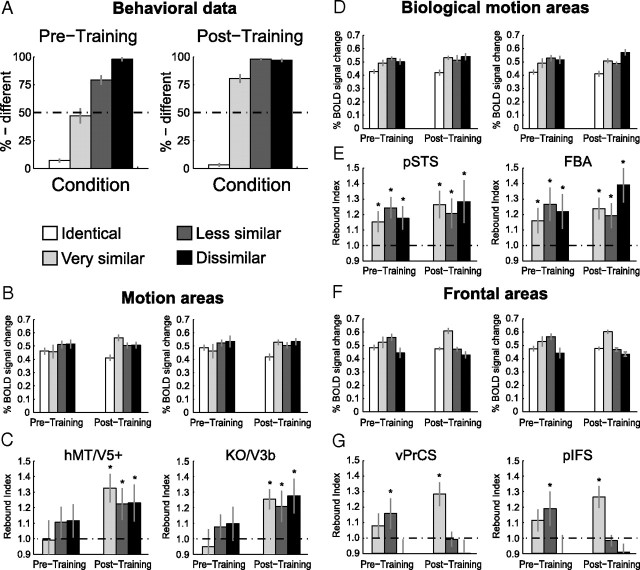
Figure 3.
Results of experiment 1: Learning of novel natural movements. A, Psychophysical data obtained during the scanning sessions before training (Pretraining) and after training (Post-training). The data are expressed as percentage of different judgments for the different conditions. Error bars indicate SEM across subjects. B, Average fMRI response across subjects in general motion-related areas (hMT/V5+, KO/V3B) before and after training (±SEM). C, Rebound indices for the fMRI responses in general motion-related areas before and after training. Rebound values were calculated by dividing the average fMRI responses for each condition by the fMRI responses for the Identical condition. An index of 1 indicates adaptation, while an index >1 indicates sensitivity to changes in the stimulus. Error bars represent SEM; as they incorporate the error estimates of both numerator and denominator SEMs appear rather large. D, Average fMRI response across subjects (±SEM) in biological motion-related areas (pSTS, FBA) before and after training. E, Rebound indices (±SEM) for the fMRI responses in biological motion-related areas before and after training. F, Average fMRI response across subjects (±SEM) in frontal areas (vPrCS/pIFS) before and after training. G, Rebound indices (±SEM) for the fMRI responses in frontal areas before and after training. Asterisks indicate rebound indices significantly higher than one.

