
Figure 1.
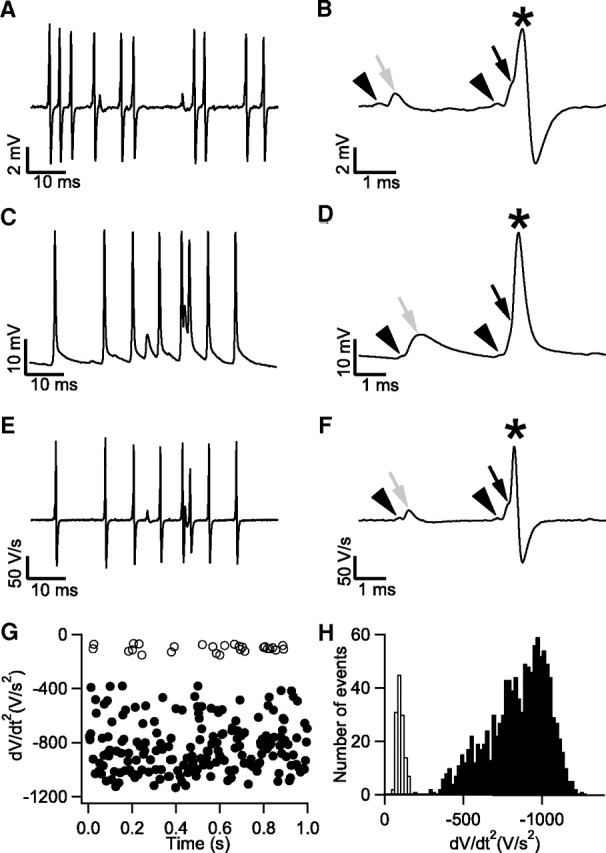
Spike failures in the adult mouse MNTB during in vivo extracellular and whole-cell recordings. A, Spontaneous activity during extracellular recording. B, part of A shown at higher time resolution containing two complex waveforms. Black arrowheads indicate prespikes, black arrow indicates suprathreshold eEPSP, gray arrow indicates subthreshold eEPSP, and star indicates eAP. C, Spontaneous activity of a principal cell recorded in whole-cell configuration. D, part of C containing a subthreshold (gray arrow) and a suprathreshold EPSP (black arrow). Prespikes are marked by the arrowheads, and the action potential is marked by a star. E, First derivative of traces shown in C. F, First derivative of traces shown in D. Note the resemblance with the extracellular waveform from the recording shown in B. G, The minimum of the second derivative during the repolarization phase of the membrane potential was much smaller for subthreshold EPSPs (open circles) than for action potentials (closed circles). H, Histogram illustrating the difference in minimum second derivative between subthreshold EPSPs (open bars) and action potentials (closed bars).