
Figure 4.
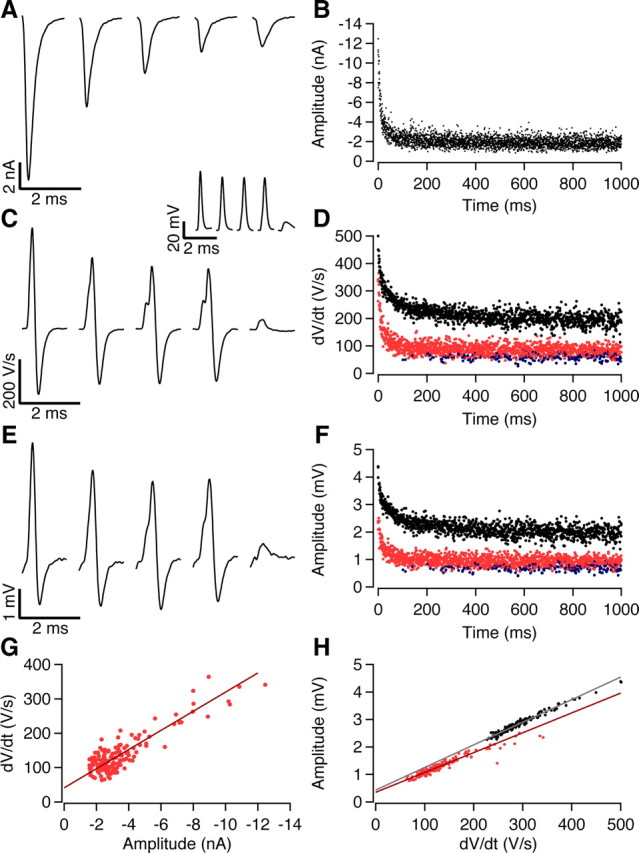
The complex extracellular waveform can be used to estimate both release and postsynaptic excitability. A, Whole-cell voltage-clamp slice recording showing EPSCs evoked at 0, 12, 48, and 102 ms during a 500 Hz stimulus train with a total duration of 1 s. B, Time course of synaptic depression during the 500 Hz stimulus train. Six repetitions have been overlaid. C, First derivative of synaptic potentials evoked at 0, 12, 48, and 102 ms during a 500 Hz train recorded in whole-cell configuration. Inset shows undifferentiated waveforms. The inflection becomes progressively more prominent as the rate of rise of the EPSP decreases due to STD. The last waveform shows the first postsynaptic failure. D, Time course of depression of iEPSP′ (red circles, suprathreshold; blue, failures) and iAP′ (black circles) during the 500 Hz train. Three repetitions have been overlaid. E, Extracellular potentials recorded simultaneously as responses shown in C. F, Time course of depression of eEPSP (red circles, suprathreshold; blue, failures) and eAP (black circles) during the 500 Hz train. Three repetitions have been overlaid. G, Relation between maximum rate of rise of the intracellular EPSP and EPSC amplitude. Solid line is the regression line (r = 0.96). H, Relation between either eEPSP and iEPSP′ (red; r = 0.95) or eAP and iAP (black; r = 0.98). In G and H, only the first 50 responses of the stimulus train are shown.