
Figure 9.
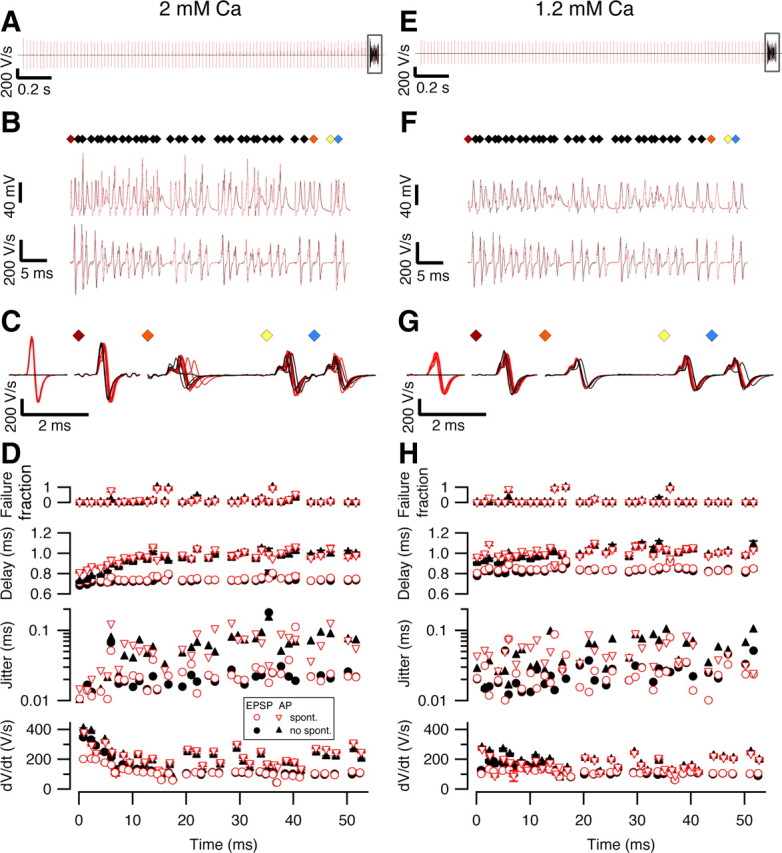
Contribution of spontaneous activity to precision and reliability of the calyx of Held synapse. A–H, Cells were stimulated with a pattern obtained from an in vivo postsynaptic auditory response (Fig. S5, available at www.jneurosci.org as supplemental material) at a calcium concentration of either 2 mm (A–D) or 1.2 mm (E–H). In all panels, red traces or symbols indicate responses obtained following a 2 s, 50 Hz spontaneous activity train, as illustrated in A and E. Boxed areas in A and E are shown at higher time resolution in B and F, respectively, in which diamonds in top panel mark stimuli, middle traces show raw data including (partially truncated) stimulus artifacts, and lower traces show first derivatives with stimulus artifacts subtracted. The first and last three stimuli of the in vivo pattern (colored diamonds) are shown in C and G at higher time resolution. Two example traces, one with and one without spontaneous activity, have been overlaid in A and B. Five traces have been displayed for each condition in C and G. In D and H, from top to bottom, fraction of postsynaptic spike failures during the 10 repetitions of the in vivo pattern, delay from the start of the stimulus, SD of this delay (jitter), and rate of rise are shown. For the last three panels, triangles indicate action potential measurements, whereas circles indicate measurements made on the synaptic potentials. Data in D and H are shown as mean ± SE of the 10 repeats of the in vivo pattern, except when SE was smaller than symbol size.