
Figure 10.
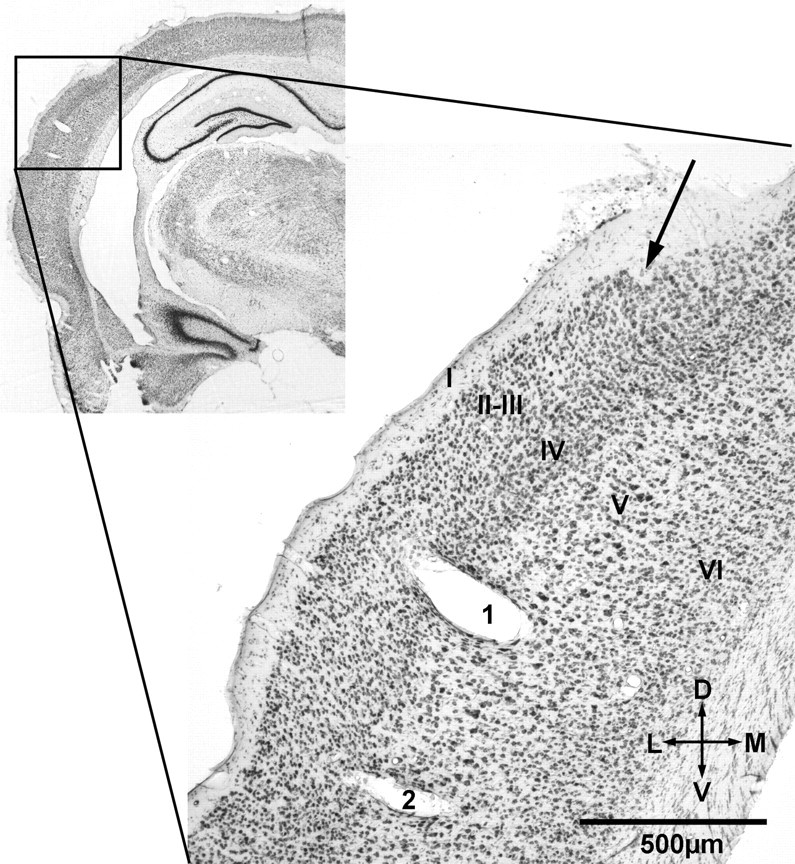
Histological reconstruction of recording sites. Example of the histological reconstruction of recordings sites in one animal. The inset at the top left side shows the left hemisphere with the region of higher magnification indicated by a black frame. The magnified coronal section (50 μm thick; scale bar, 500 μm) shows the electrolytic lesions of one electrode track in the primary auditory cortex [according to Paxinos and Watson (1998) at ∼6 mm caudal from bregma]. Lesions were performed after finishing the experiments at the site of the first recording (marked with 1) and the last recording (marked with 2) in a tangential approach. The arrow at the top right side shows the penetration site of the electrode into the cortex. Additionally, the cortical layers are indicated (according to Zilles, 1985) in roman numbers.