
Figure 3.
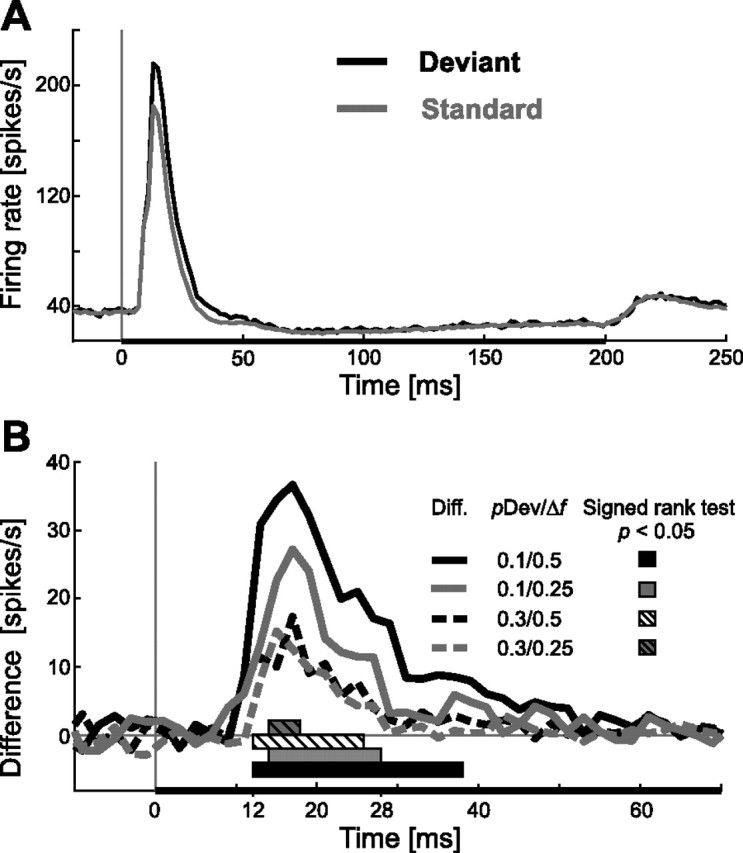
Time course of neuronal adaptation during acoustic stimulation in A1. A, Average response of 51 units during pure tone stimulation with the standard (gray line) and the deviant (black line) in a population PSTH (bin size, 2 ms; stimulus condition 0.1/0.5). Duration of the pure tone stimulus (200 ms) is indicated by a black horizontal bar below the PSTH. B, Time course of the difference signal (deviant response − standard response) from all four different stimulus configurations (i.e., 4 lines, as indicated) during the first 70 ms after stimulus onset (bin size, 2 ms). A binwise statistical comparison (signed rank test) was performed for all units for each stimulus configuration (4 populations) against a 0 distribution. Bars below the graphs indicate the period in which each difference curve was significant different from 0 (p < 0.05, Bonferroni's corrected for multiple comparisons).