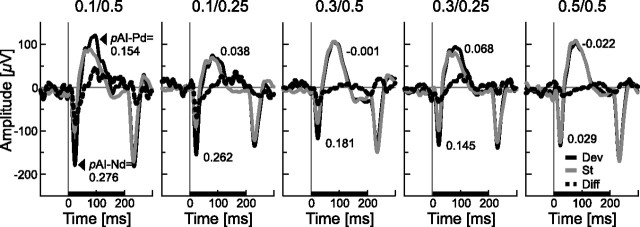
Figure 6.
Example for adaptation in the evoked local field potentials, recorded simultaneously with the spike data (same electrode) shown in Figure 1, C and D. eLFPs to standard tones (gray line) differed mainly during response onset from eLFPs to deviant tones (black lines). The difference signal is shown as dashed line, and the stimulus is shown as black bar on the time axis. All five stimulus conditions were measured, each panel showing one condition. Two components of the response were further analyzed: the Nd and Pd as indicated in the first plot. Adaptation indices for each component (pAI–Nd and pAI-Pd) were computed on the basis of the respective peak amplitudes of the mean curves. Their values are given in the graphs.

