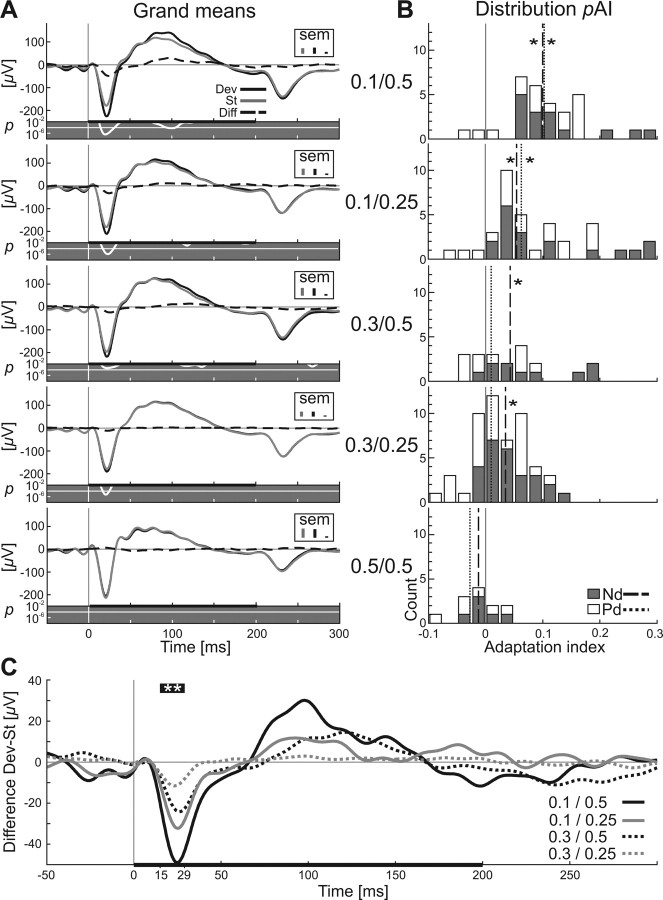
Figure 7.
Grand means of eLFPs and difference signal in A1. A, Grand mean of eLFPs for standard tones (gray line) and deviant tones (black line) for all stimulus conditions (indicated at the right of the plots). Stimulation parameters are given for each panel as pDev/Δf in the column between A and B. The dashed line represents the difference signal (deviant − standard) and the black bar the stimulus (200 ms). The difference between responses to deviants and standards was tested for each time point during stimulation for statistical significance (signed rank test), and the resulting p values are plotted below the eLFPs curves as white lines with a gray background (logarithmic scale) together with the Bonferroni's level for multiple testing (white line). Maximum SEM values for the three different eLFP curves are indicated as small bars in the top right corner of each panel. B, Distribution of adaptation indices of eLFPs in the rat AC depending on stimulation condition. Adaptation indices (pAI) were calculated for each eLFP for two of its components, negative deflection (gray) and positive deflection (white), in the same way it was done for quantifying the spike adaptation. Dashed lines in histograms indicate the median of pAI–Nd, and dotted lines indicate the median of pAI–Pd (signed rank test, *p < 0.05). C, Grand mean of the difference signal of eLFPs indicates adaptation during the stimulus onset-related negative wave for all stimulus configurations. The time window in which all four difference signals are significantly different from 0 (signed rank test, **p < 0.01) is indicated by the thick black bar (including **) above the four curves and as values on the time axis (15–29 ms). Stimulus duration is indicated by the horizontal bar at the bottom. Stimulation parameters for each curve are given as pDev/Δf.

