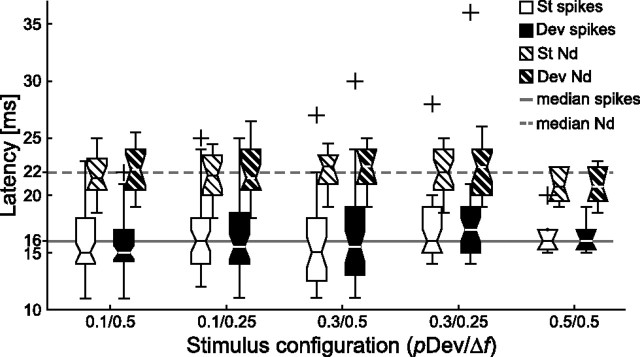
Figure 9.
Latencies of the isolated units and eLFPs peak negative deflection. Distribution of peak latencies of spikes (1 ms resolution) and eLFPs negative deflection, separated for deviants and standards. The spike latencies were computed as the bin with maximum response in the PSTH and the eLFP latencies as the sample point with the lowest amplitude. There is no statistical difference between any of the deviant–standard combinations and no effect of stimulus configuration.

