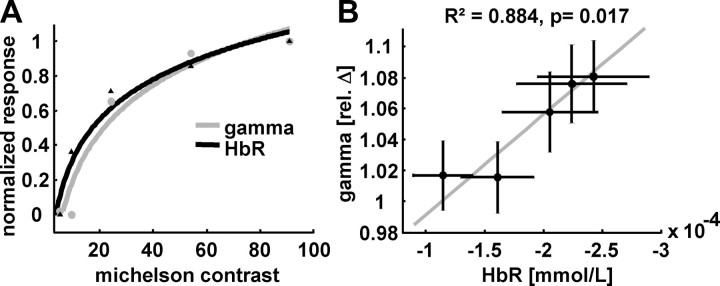
Figure 5.
Relationship between contrast, occipital gamma power, and colocated HbR. A, A logarithmic model is most suitable to explain the relationship between Michelson contrast and gamma power (gray line) as well as HbR (black line). B, When gamma power is plotted against HbR, both parameters reveal a strong linear relationship. The horizontal and vertical bars denote SEM across subjects. The gray line depicts the fitted linear model.

