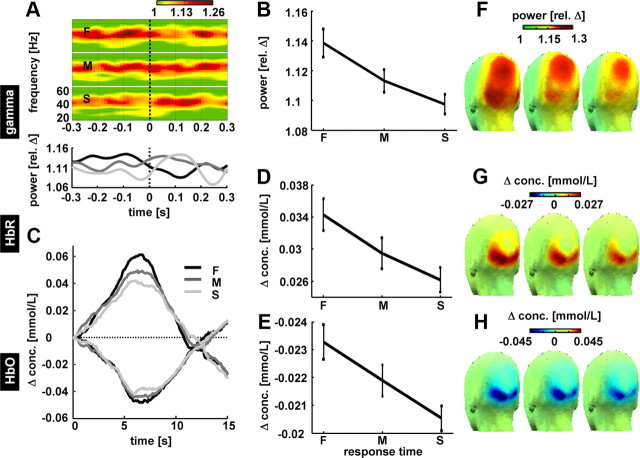
Figure 6.
Response variation attributable to changes in internal state-dependent variables (preparedness). Within the strongest contrast (c5), epochs based on velocity change onset were ranked according to the RT, divided in equally large groups of fast (F), medium (M), and slow (S) RTs and averaged across subjects. A, Top, Time–frequency representations of gamma power (pooled occipital electrodes O1 and O2) for fast, medium, and slow trials depicted for a time window of −0.3 to 0.3 s after velocity. Note that the gamma power shortly before the change best predicts RT. A, Bottom, Time course of gamma activity (same as above but averaged across frequencies 35–70 Hz). B, Gamma activity averaged from 200 to 100 ms before the velocity change for fast, medium, and slow trials shows a clear decrease in gamma activity with increasing RT. Error bars denote SEM. C, Grand average hemodynamic response for fast, medium, and slow trials from occipital ROI (pooled probes correspond to the location of electrodes O1 and O2). D, E, Changes in HbO (D) and changes in HbR (E) for fast, medium, and slow trials. Note that HbR scaling is inverted (decrease in concentration upward as in Fig. 4). F–H, Scalp distribution of gamma activity, HbO, and HbR for fast (F), medium (M), and slow (S) trials.

