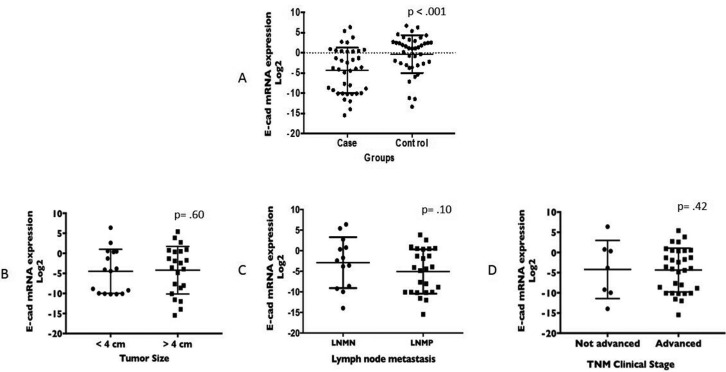
Figure 1.
Student’s t-test. A) Comparison of the E-cadherin gene expression values between the OSCC case (mean -4.32 ± 5.67; minimum -15.46; maximum 6.38) and control (mean -.31 ± 4.72; minimum -13.32; maximum 6.70) groups. Mann–Whitney test. Comparison of the E-cadherin gene expression values in the T, N and TNM clinical stages. B) Tumor not advanced (< 4 cm) vs Tumor advanced (> 4 cm): mean 4.76 ± 5.81 vs -4.20 ± 5.93, minimum -10.19 vs -15.46, maximum 6.38 vs 5.40, respectively. C) Lymph node metastasis negative vs positive, mean -1.81 ± 5.67 vs -5.67 ± 5.37, minimum -9.96 vs -15.46, maximum 6.38 vs 3.83, respectively. D) TNM clinical stage not advanced vs advanced: mean -2.34 ± 7.04 vs -4.43 ± 5.49, minimum -9.96 vs -15.46, maximum 6.38 vs 5.40, respectively.

