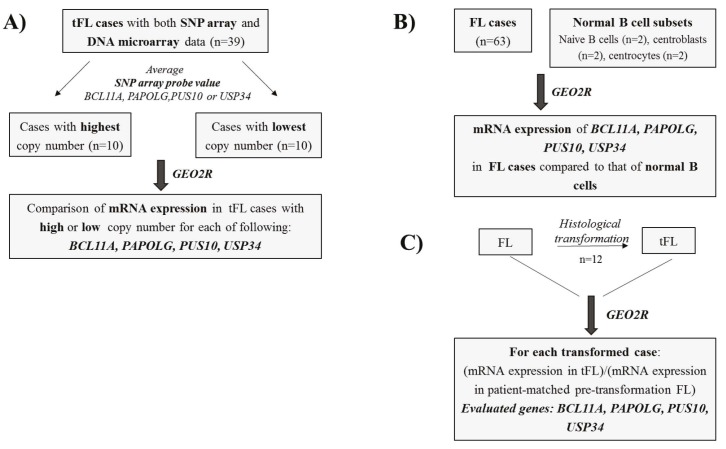
Figure 2.
Schematic depiction of the strategies used for mRNA expression analyses of amplified genes in follicular or transformed follicular lymphoma cases. A) Transformed follicular lymphoma cases were divided into two groups based on the high or low copy number of BCL11A, PAPOLG, PUS10, and USP34, which is determined using the values of normalized SNP array data. mRNA expression values were then analyzed with the GEO2R bioinformatics tool using the available DNA microarray probe sets (GEO accession number: GSE81184); B) Transcript expression of four amplified genes was evaluated with the GEO2R tool by comparing the expression levels in FL cases vs. normal B cell subsets (GEO accession number: GSE55267); C) Transcript expression levels of the four amplified genes in 12 tFL cases (i.e. DLBCL) were compared one by one with those of pretransformation levels for each tFL case by using the GEO2R tool (GEO accession number: GSE3458).

