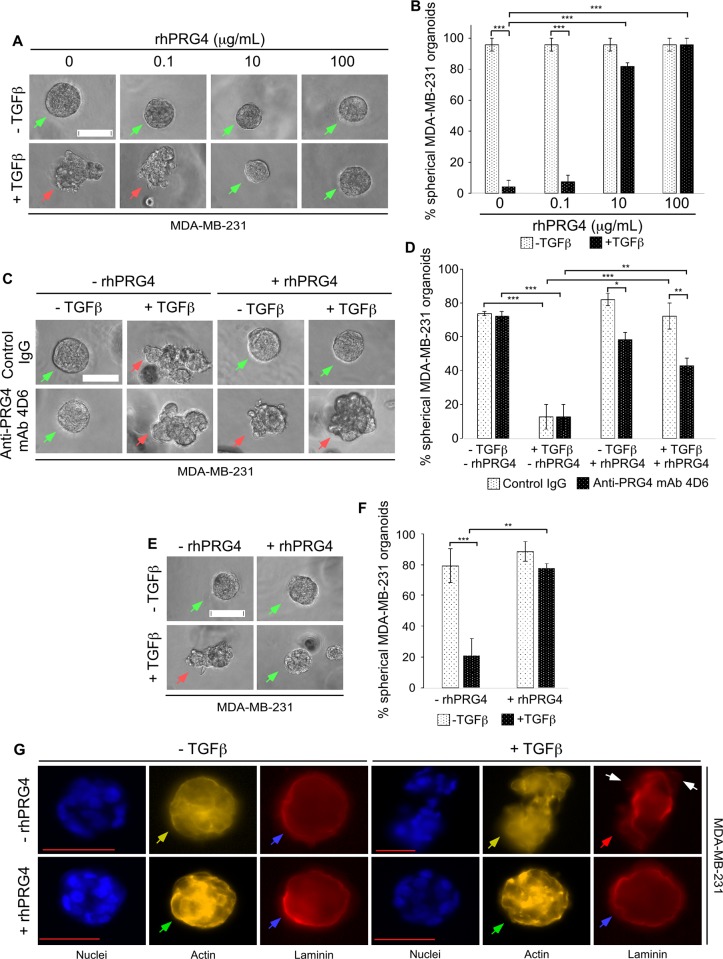
Fig 1. rhPRG4 suppresses TGFβ-induced invasive growth of MDA-MB-231 cell-derived organoids.
(A) Representative DIC light microscopy images of 8-day old three-dimensional MDA-MB-231 cell-derived organoids that were left untreated or incubated with 100 pM TGFβ, without or with increasing concentrations of rhPRG4 (0.1, 10 and 100 μg/mL) in complete growth medium. (B) Bar graph depicts mean ± SEM proportion of spherical organoids expressed as a percentage of total colonies counted for each experimental condition from four independent experiments including the one shown in A. (C) Representative DIC light microscopy images of 8-day old three-dimensional MDA-MB-231 cell-derived organoids that were incubated with 10 μg/mL of mouse IgG or anti-PRG4 mAb 4D6, along with or without 100 pM TGFβ and 100 μg/mL rhPRG4 in different combinations in complete growth medium. (D) Bar graph depicts mean ± SEM proportion of spherical organoids expressed as a percentage of total colonies counted for each experimental condition from three independent experiments including the one shown in C. (E) Representative DIC light microscopy images of untreated or 100 pM TGFβ-treated 8-day old three-dimensional MDA-MB-231 cell-derived organoids using Matrigel that was mixed with vehicle or 100 μg/mL rhPRG4. (F) Bar graph depicts mean ± SEM proportion of spherical organoids expressed as a percentage of total colonies counted for each experimental condition from three independent experiments including the one shown in E. (G) Representative fluorescence microscopy images of nuclear (Hoechst 33342, blue), actin (TRITC- phalloidin, yellow), and laminin (rat anti-laminin/anti-rat Alexa 647, red) staining of formaldehyde-fixed 8 day old MDA-MB-231 cell-derived organoids that were left untreated or incubated with TGFβ, with or without rhPRG4, in complete growth medium. This experiment was repeated two independent times with similar outcomes. Significant difference, ANOVA: *P ≤ 0.05, **P ≤ 0.01, ***P ≤ 0.001. Scale bar indicates 50 μm. For Fig 1A, 1C and 1E, green and red arrows indicate spherical and invasive organoids, respectively. For Fig 1G, green arrows indicate cortical actin, yellow arrows indicate stress-fibre like actin, blue arrows indicate intact laminin rings, red arrow indicates disruption of laminin ring, and white arrows indicate representative sites of laminin loss.

