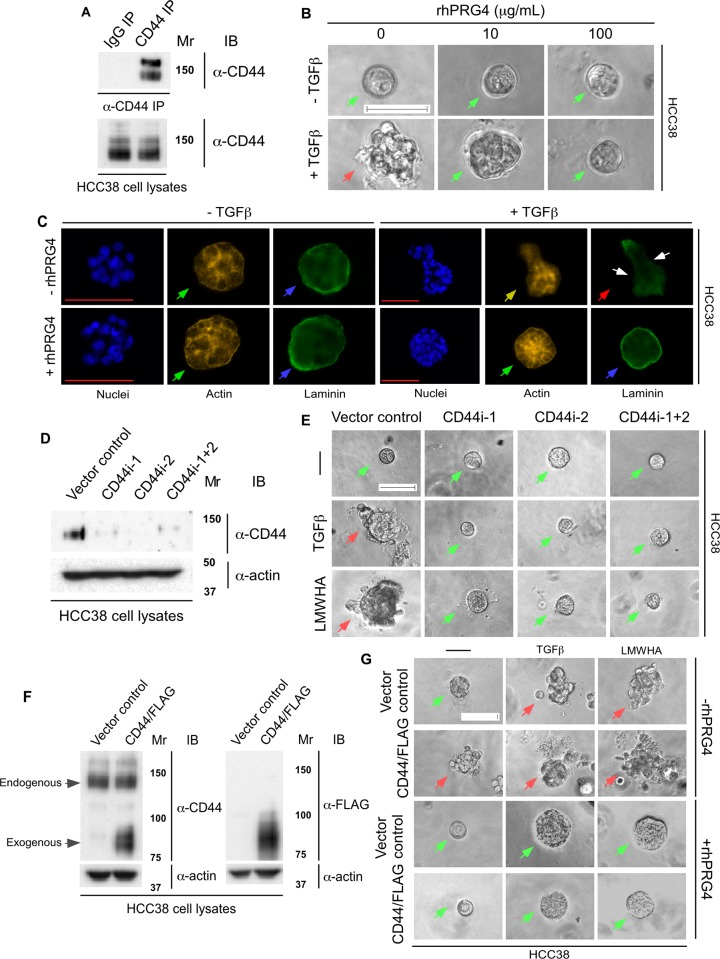
Fig 6. rhPRG4 acts in a CD44-dependent manner to supress TGFβ- or LMWHA-induced invasive growth of HCC38.
(A) Lysates of HCC38 cells were subjected to immunoprecipitation using a mouse CD44 antibody (CD44 IP) or a non-specific mouse IgG antibody (IgG IP) followed by CD44 immunoblotting. The protein abundance of CD44 in the lysates was confirmed by CD44 immunoblotting. (B) Representative DIC light microscopy images of 6-day old three-dimensional HCC38 cell-derived organoids that were left untreated or incubated with 100 pM TGFβ, without or with increasing concentrations of rhPRG4 (10 and 100 μg/mL) in complete growth medium. (C) Representative fluorescence microscopy images of nuclear (Hoechst 33342, blue), actin (TRITC- phalloidin, yellow), and laminin (rat anti-laminin/anti-rat Alexa 488, green) staining of formaldehyde-fixed 6-day old HCC38 cell-derived organoids that were left untreated or incubated with TGFβ, with or without rhPRG4, in complete growth medium. This experiment was repeated two independent times with similar outcomes. (D) CD44 immunoblotting of lysates of HCC38 cells transfected with the pU6 RNAi vector (vector control), or the plasmids CD44i-1, CD44i-2, alone or together (CD44i-1+2) expressing shRNAs targeting two distinct sequences of CD44 mRNA. Actin was used as loading control. (E) Representative DIC light microscopy images of untreated (-), 100 pM TGFβ or 400 μg/mL LMWHA-treated 6-day old three-dimensional organoids derived from HCC38 cells transfected with vector control or CD44i-1, CD44i-2, individually or in combination. (F) CD44 and FLAG immunoblotting of lysates of HCC38 cells transfected with an empty vector or CD44/FLAG expression plasmid. Actin was used as loading control. (G) Representative DIC light microscopy images of vector control or CD44/FLAG expressing 6-day old HCC38 cell-derived organoids grown in complete growth medium without (-) or with 100 pM TGFβ or 400 μg/mL LMWHA, alone or with 100 μg/mL rhPRG4. Mr indicates Markers’ molecular size. Scale bar indicates 50μm. For Fig 6B, 6E and 6G green arrows and red arrows indicate spherical and invasive organoids, respectively. For Fig 6C, green arrows indicate cortical actin, yellow arrow indicates stress-fibre like actin, blue arrows indicate intact laminin rings, red arrow indicates disruption of laminin ring, and white arrows indicate representative localized sites of laminin loss.

