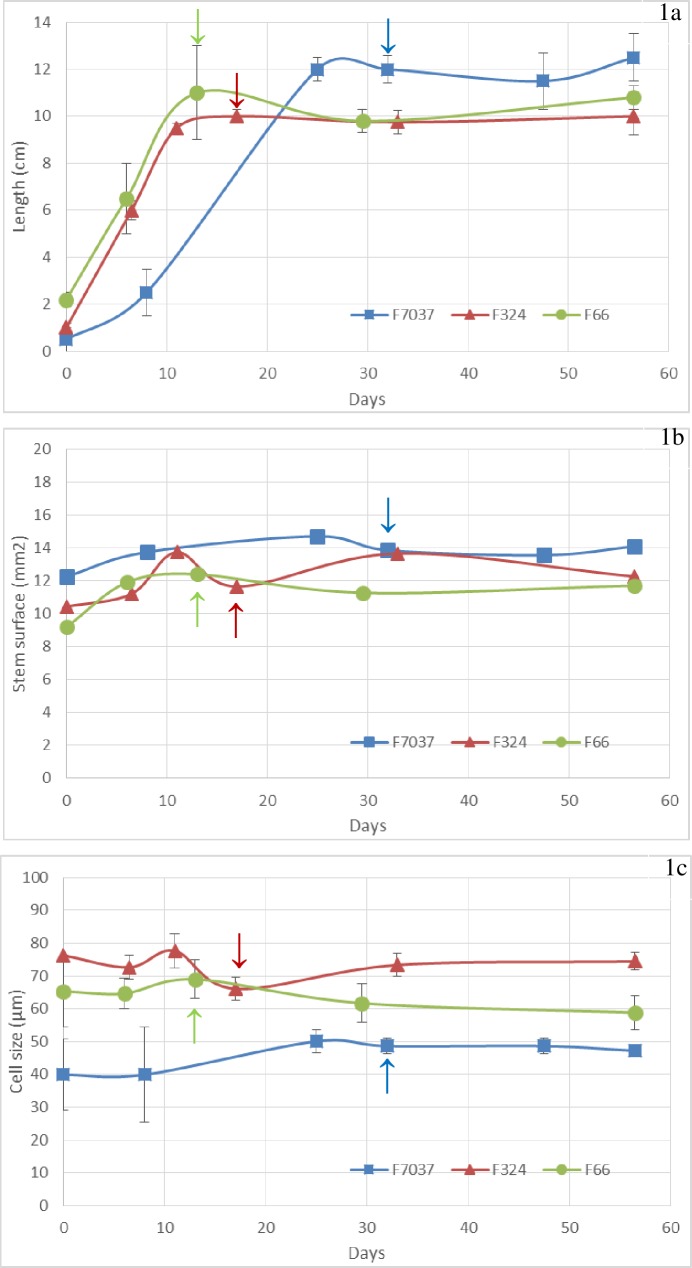
Fig 1. Changes in the morphological parameters during internode development in the three genotypes.
Fig 1A: length of the principal ear internode, Fig 1B: cross-section surface and Fig 1C: cell size of the parenchyma cells. Data were averaged across the three blocks collected in 2011. Arrows = silking date. Smoothed curves were used only for graphical purposes.

