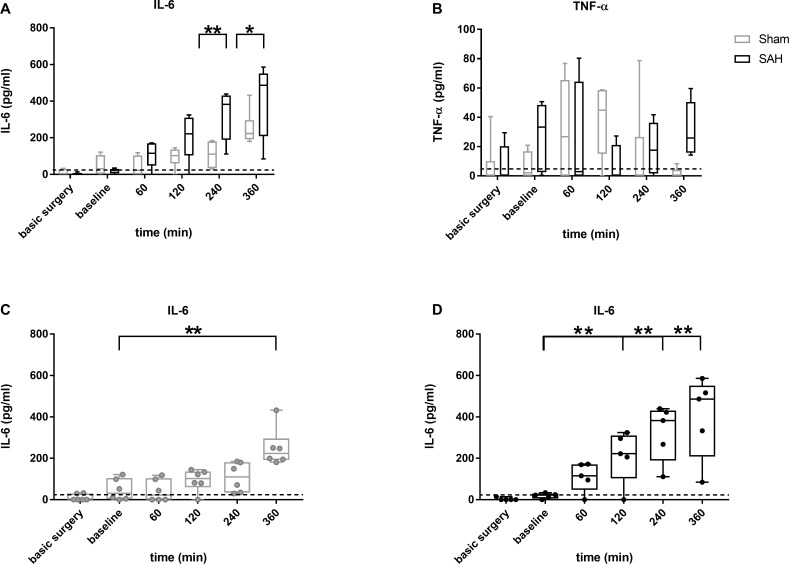
Fig 3. Box plots of IL-6 and TNF-α in blood samples from SAH (black) and sham (grey) animals.
Data are presented as boxplot diagrams; the whiskers represent the minimum and maximum values, the dots show single points. Data were analyzed using repeated measures 2-way ANOVA followed by multiple comparisons tests: Sidak´s (comparisons between the groups; (A, B) IL-6 (A) and TNF-α (B) sham: n = 6; SAH: n = 5) or Tukey´s ((C, D) for IL-6, comparisons within the group; only significances in respect to baseline are depicted); * p < 0.05; ** p < 0.01; dotted line: minimum detectable dose (IL-6: 21pg/ml, TNF-α 5pg/ml).

