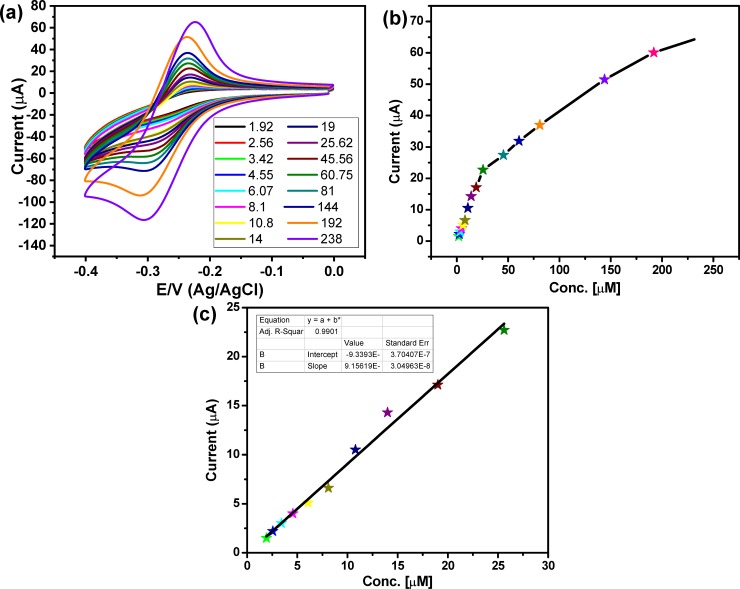
Fig 5.
(a) Cyclic voltammograms of different concentrations of pyocyanin from 238 𝜇M to 1.9 𝜇M at scan rate 50 mV/sec, (b) the relationship between the anodic current peaks and the pyocyanin concentration, and (c) linear relation between current peak and pyocyanin concentrations from 25.62 𝜇M to 1.9 𝜇M.

