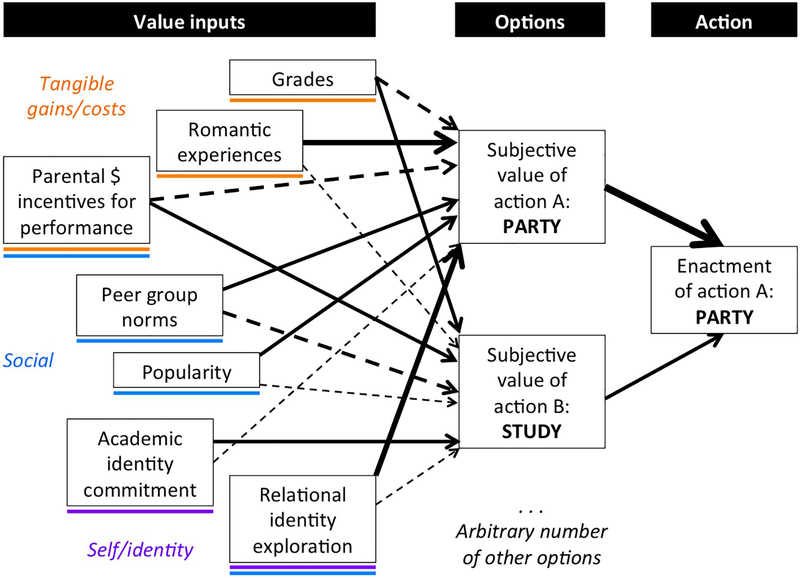
Figure 1. Value-based decision-making in adolescence.
Note. Solid arrows from value inputs represent positive value, dashed arrows represent negative value, and line thickness indicates relative weight. Sample tangible inputs (primary or secondary gains and costs) are tagged in orange, sample social inputs are tagged in blue, and sample self/identity related inputs are tagged in purple. Value inputs can be cross-tagged. Adapted from (27).

