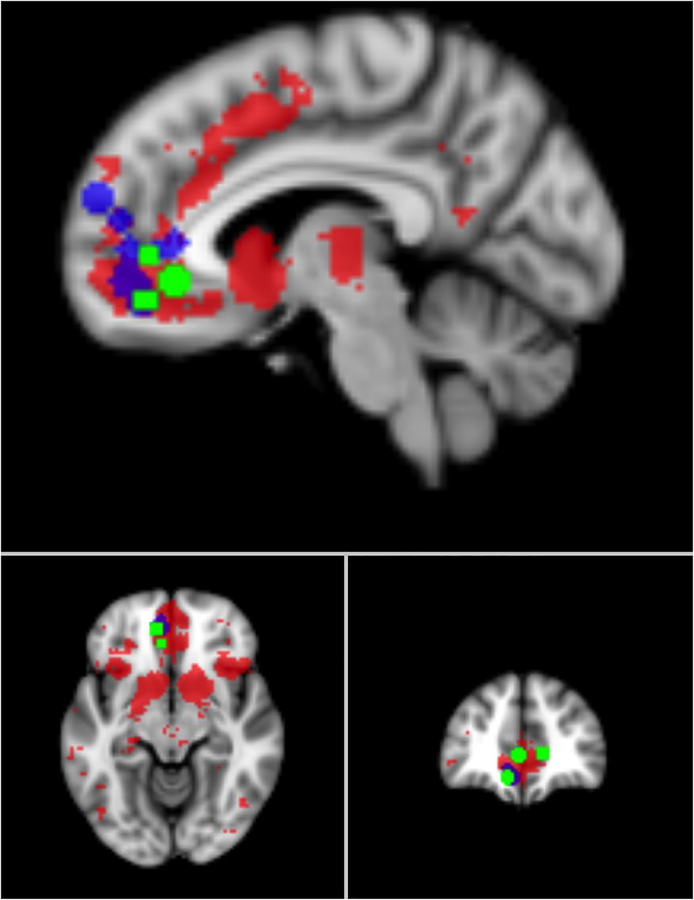
Figure 2. Developmental self-evaluation studies and value.
Note. Regions in red are likely to appear in studies using the term value, calculated by Neurosynth’s automated meta-analysis tool. Peaks from studies of self-evaluation using typically developing adolescents are overlayed. Blue represents peaks from the self > other contrast in child or adolescent samples, and green represents peaks that show increases during self-evaluation with age. Slices are displayed at x = −6, y = 44, and z = −10. To be included here, studies had to report activations in medial prefrontal cortex from the contrast of self > other from a developmental sample or changes in that contrast with age. A full list of studies and coordinates can be found at: http://osf.io/64qh5.

