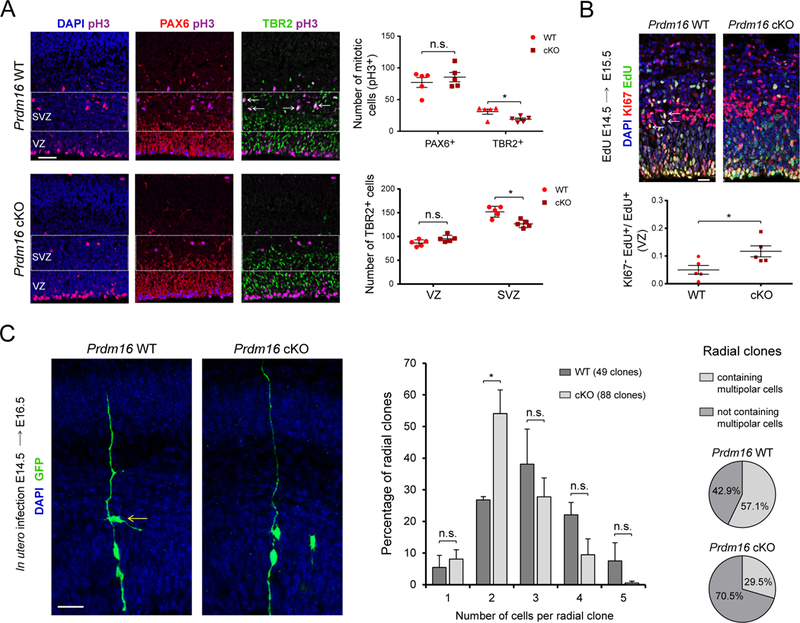
Figure 3. PRDM16 controls intermediate progenitor generation and expansion.

(A) E15.5 WT and Prdm16 cKO cortical sections immunostained for PAX6, TBR2 and pH3. The ventricular zone (VZ) and subventricular zone (SVZ) are indicated. Arrows show examples of TBR2+/pH3+ cells in the SVZ of WT cortex. Top plot shows quantification of PAX6+/pH3+ and TBR2+/pH3+ cells. Lower plot indicates the number of TBR2+ cells (n=5).
(B) Cell cycle exit analysis. Arrows indicate examples of KI67+/EdU+ cells. The fraction of KI67−/EdU+ cells relative to EdU+ cells was quantified (n=5).
(C) Clonal analysis of radial glia. The number of cells per clone was analyzed. Pie charts indicate the percentage of clones containing cells with multipolar morphology (arrow). Data represents mean ± SE; statistical analysis is unpaired Student’s t test (*p < 0.05, **p < 0.01, *** p < 0.001; n.s., not significant). Scale bars: 50 μm (A), 20 μm (B, C).
