
Figure 4. Transcriptional profiling of WT and Prdm16 cKO cells at three stages of neurogenesis.
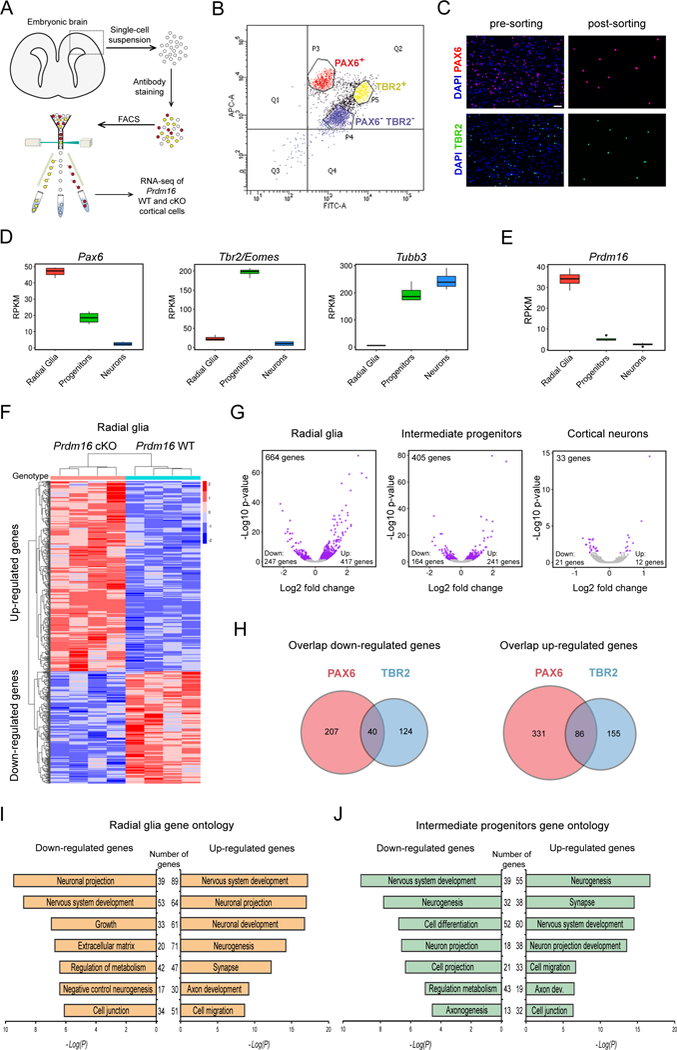
(A) Experimental design for transcriptional profiling of E15.5 cortical cells.
(B) Representative plot showing sorting gates for PAX6+ and TBR2+ cells. Double negative cells (PAX6−/TBR2−) are cortical neurons.
(C) Representative images of cell suspensions stained for DAPI, PAX6 and TBR2. Scale bar: 50 μm.
(D) Expression of Pax6, Tbr2 and Tubb3 in sorted cells from E15.5 WT cortex.
(E) Expression of Prdm16 in sorted cells from E15.5 WT cortex.
(F) Heat-map representing changes of gene expression in Prdm16 cKO radial glia (p < 0.05).
(G) Volcano plots showing fold changes of gene expression in cKO cells. Each plot indicates up-regulated and down-regulated genes (purple circles).
(H) Venn diagrams showing the overlap of down-regulated or up-regulated genes between mutant PAX6+ and TBR2+ cells. The number of genes is indicated.
(I) Gene ontology analysis of differentially expressed genes between WT and Prdm16 cKO radial glia.
(J) Gene ontology analysis of differentially expressed genes between WT and Prdm16 cKO intermediate progenitors.
All transcriptome analyses used 4 biological replicates per genotype. RPKM: Reads Per Kilobase of transcript per Million mapped reads.