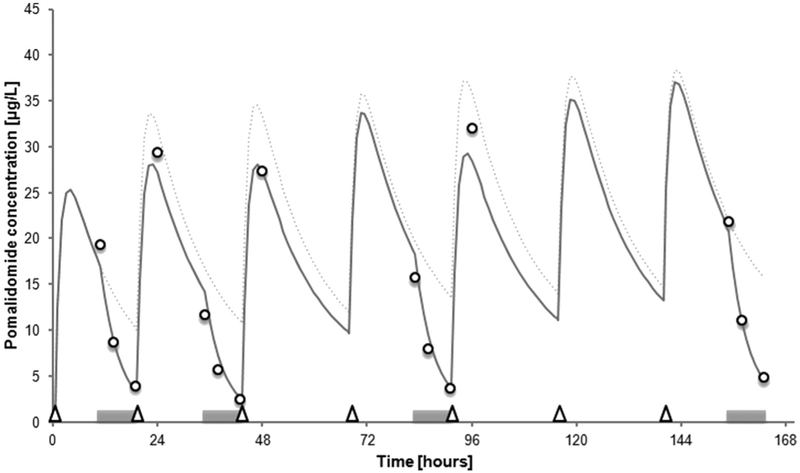
Figure 1.
Predicted (continuous line) and measured (open circles) pomalidomide concentrations over time. HCO dialysis sessions are indicated by grey horizontal bars; pomalidomide doses (2 mg), by open triangles. Predicted concentrations (with 2 mg/d dosage) in the absence of dialysis denoted by dotted line.

