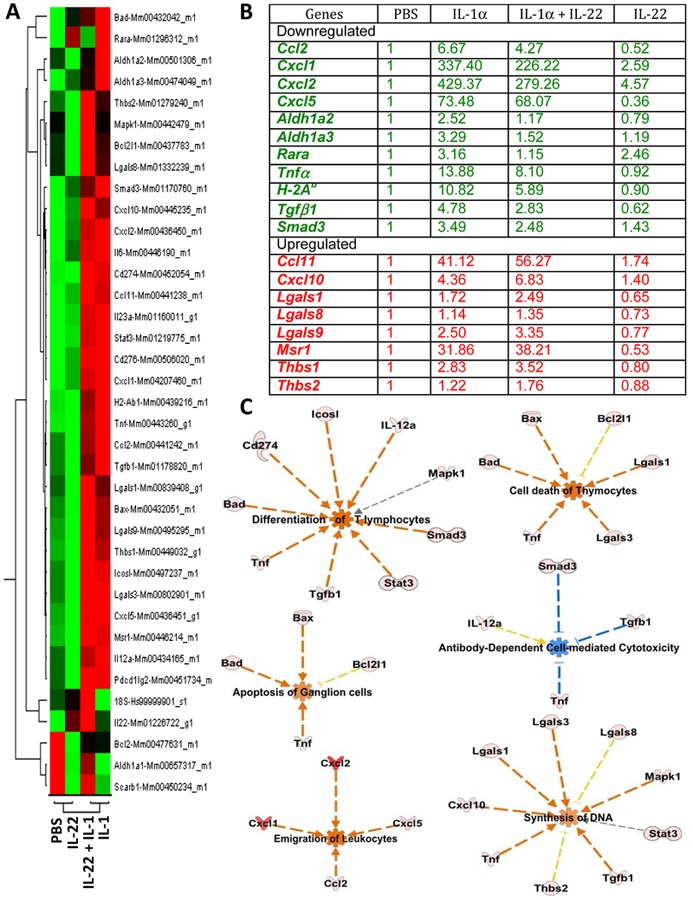
Figure 6: IL-22 alters transcription profile of many genes during active inflammation in the eye.
C57BL/6J mice were injected intravitreally with 2μl of PBS, or 2μl (100ng) of recombinant IL-1, or 2μl (200ng) of recombinant IL-22, or a mixture of both IL-1α(100ng) and IL-22 (200ng) in a total volume of 2μl, into each eye. Retinal tissues from 8–10 eyes/group were collected 24 hours after injection and were pooled within each group for RNA isolation and real-time RT-PCR. Relative expressions of selected genes were compared after normalizing them to ‘murine Gapdh’ expression (endogenous control) and to PBS injected group (reference sample). Experiment was repeated twice and data (comparative Ct) from two independent experiments were analyzed using ‘Comparative Ct study’ in 7500 software v2.0.6. In this method, Ct values for each individual gene from two independent experiments were averaged before applying normalization. (A) Gene expression profile of four treatment groups from Comparative Ct study shown as a heat map. (B) Relative fold expression levels of selected genes. (C) Functional pathways perturbed by IL-22 during inflammation in the eye. Presence of IL-22 in the eye during inflammation negatively regulate pathways directed towards acute inflammation and tissue damage and positively regulate pathways directed towards dampening immune response or promoting tissue growth. Using Ingenuity Pathway Analysis (IPA) software, ‘Core comparison analysis’ of the Fold changes in gene expression was done between samples treated with (i)IL-1 alone vs. (ii) IL-1 + IL-22. Shown here are selected functional pathways that had statistically significant differences between the two samples, based on the expression profile of genes included in this study. Predicted activation (red) or inhibition (blue) of a biological function in either one of the two samples and their predicted relationship (red line – leads to activation, blue line – leads to inhibition, gray – effect not predicted, yellow – findings inconsistent with state of downstream molecules) based on knowledge base (IPA) are depicted.

