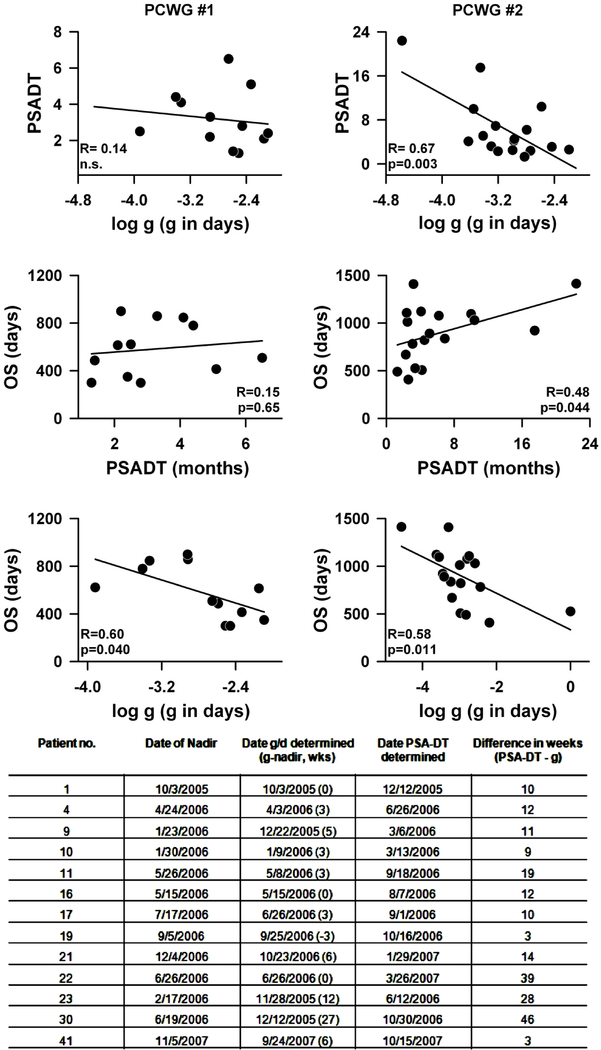
Figure 2:
Comparison of PSA-DT and g were made using two data sets: PCWG #1 = data gathered early in the study when the guidelines of the Prostate-Specific Antigen Working Group [22] were followed in making clinical decisions. Progression scored if two consecutively rising PSA levels were obtained. PSA-DT estimated from the nadir to the progression end-point. PCWG #2 = data obtained in the latter part of the study when the guidelines of the Prostate Cancer Clinical Trials Working Group 2 [23] were used to make clinical decisions. Treatment continued until radiographic or symptomatic progression was seen, or as long as treatment was tolerated. PSA-DT estimated from the point of progressive disease to the time treatment was terminated. For each of the datasets, the top panels compare PSA-DT versus log g, the middle panels show the regression of OS against PSA-DT while the lower panels depict the correlation of log g with OS. Values of PSA-DT estimated using the data set from the latter part of the study correlate well with log g values and OS. The table at the bottom of the figure compares thirteen randomly chosen data sets from the ATTP study. The table summarizes when in the clinical course a reliable g or PSA-DT value comparable to that obtained with the complete data set and able to predict OS could be determined. A value for g comparable to that obtained with the entire data set could be estimated a median of 12 weeks earlier than a PSA-DT (number in parentheses is how many weeks before the nadir). The PSA-DT was calculated using the Memorial Sloan Kettering Cancer Center online tool [http://www.mskcc.org/applications/nomograms/prostate/PsaDoublingTime.aspx].

