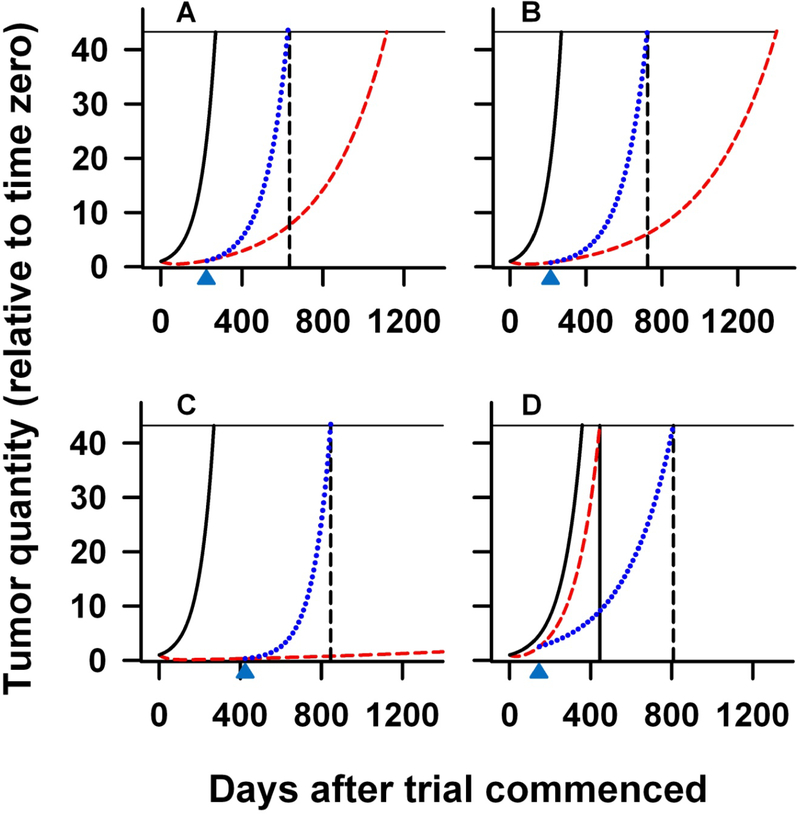
Figure 5:
Projected PSA curves computed using derived median g and d rate constants, substituted into Eq. (1). Panels (A) through (D) depict predictions derived from (A) ketoconazole plus alendronate; (B) thalidomide plus docetaxel; (C) ATTP, and (D) PSA-TRICOM studies, respectively. In each plot, the leftmost black solid lines are the projected PSA curves based on the mean of the pre-treatment g values from the thalidomide, ATTP and PSA-TRICOM studies; while the red curve is the projected PSA curve using, in each study, the appropriate g and d values calculated using PSA values obtained while patients were on study. The dashed vertical black line in each panel denotes the median OS of that study. To have the predicted PSA curve for the three chemotherapy trials (A, B and C) intersect the horizontal line (at a relative PSA signal of 44) at the actual median OS requires fitting the curve to a model (dotted blue curve) in which the growth rate, g, reverts to a higher rate when study therapy ceases (depicted by the black arrow) and continues until death at a relative PSA signal of 44. These rates are in A, B, and C, 4.2-fold, 3.0-fold, and 20.6-fold higher than the respective on-study rate in each case, and very similar to the pre-treatment rates shown as the solid black curves. In the PSA-TRICOM study (D) the blue curve, that intersects the horizontal line at the OS, is modeled with a projected slower growth rate after treatment that is 0.50 fold the on-study rate.

