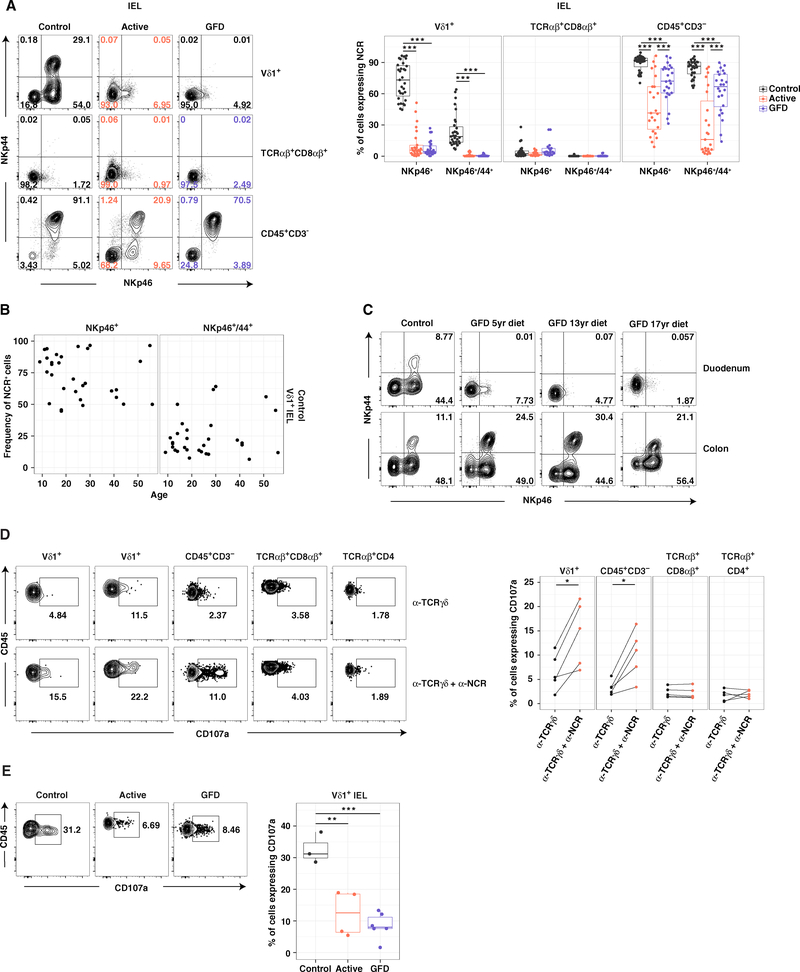
Figure 2. Innate-like Vδ1+ IELs Are Lost in CeD.
(A) Frequency of IELs expressing NKp46 with or without NKp44. Right: boxplots display first and third quartiles. ***p < 0.001. One-way ANOVA with Tukey’s test for multiple comparisons.
(B) Expression of NKp46 or NKp46/NKp44 on control Vδ1+ IELs versus age.
(C) Expression of NKp46 and NKp44 on Vδ1+ IELs from donor-matched duodenal and right colonic biopsies.
(D) Expression of CD107a on IL-15-treated IELs after stimulation with plate-bound αTCRγδ ± αNKp46. *p < 0.05. Paired t test.
(E) Expression of CD107a on Vδ1+ IELs after stimulation with phorbol myristate acetate and ionomycin. Right: boxplot displays first and third quartiles. **p < 0.01, ***p < 0.001. One-way ANOVA with Tukey’s test for multiple comparisons.
See also Figures S1 and S6.

