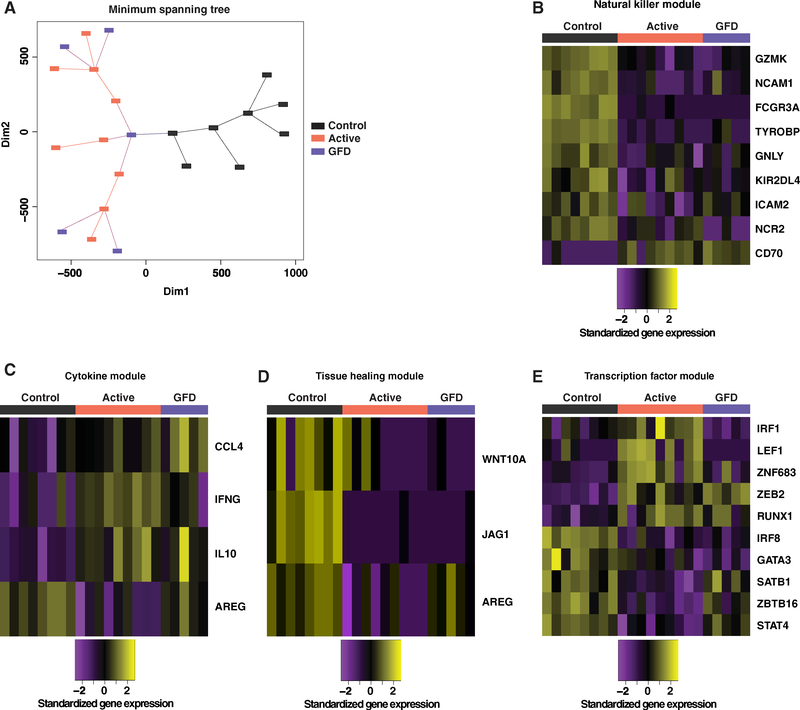
Figure 4. The Transcriptional Program of Vδ1+ IELs Is Permanently Altered in CeD.
(A) Transcriptional profiles of NCR+ Vδ1+ IELs from healthy controls, NCR− Vδ1+ IELs from patients with active CeD, and NCR− Vδ1+ IELs from patients with GFD-treated CeD compared using minimum spanning tree analysis.
(B) Differentially expressed genes from the NK module passing a false discovery rate < 10% from any two-way contrast between the Vδ1+ IEL populations in (A). Expression values were standardized (mean centered) on a per gene basis.
(C) Genes from the cytokine module passing the criteria in (B).
(D) Genes from the tissue healing module passing the criteria in (B).
(E) Genes from the transcription factor module passing the criteria in (B).
See also Figures S2 and S6.

