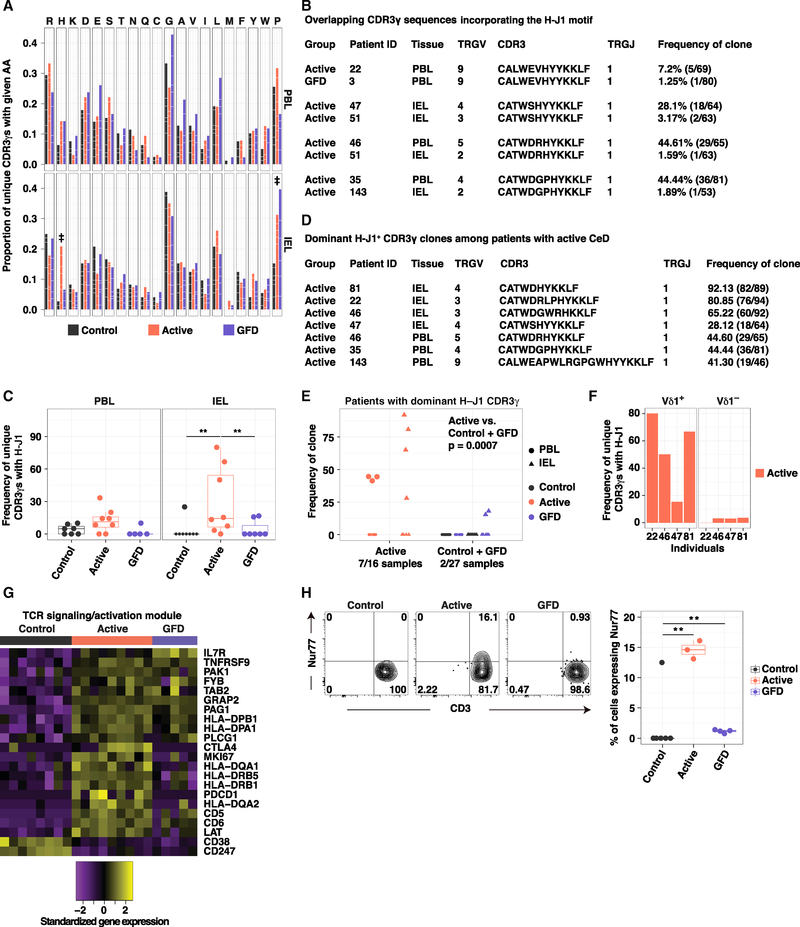
Figure 6. A Molecular Signature Defines Vδ1+ IEL Expansions in Active CeD.
(A) Proportion of unique CDR3γ sequences using a particular amino acid (aa). White lines demarcate individual contributions. Donor numbers as in Figure 5A. Double dagger (‡) denotes aas with significant differences between two groups. Firth’s penalized logistic regression and beta regression. See Table S5E.
(B) Overlapping CDR3γ sequences incorporating the H-J1 motif.
(C) Frequency of unique H-J1+ CDR3γ sequences. Boxplots display first and third quartiles. **p < 0.01. Kruskal-Wallis rank sum test with Dunn’s test for multiple comparisons.
(D) Dominant H-J1+ CDR3γ sequences among patients with active CeD.
(E) Frequency of dominant H-J1+ CDR3γ sequences. 0 denotes samples in which the dominant CDR3γ sequence lacked H-J1. Kruskal-Wallis rank sum test with Dunn’s test for multiple comparisons.
(F) Frequency of unique H-J1+ CDR3γ sequences among Vδ1+ and Vδ1− IELs from patients with active CeD.
(G) Genes from the TCR activation module passing the criteria described in Figure 4B.
(H) Expression of Nur77 in Vδ1+ IELs versus CD3. Right: boxplot displays first and third quartiles. **p < 0.01. One-way ANOVA with Tukey’s test for multiple comparisons.
See also Figures S4 and S6.

