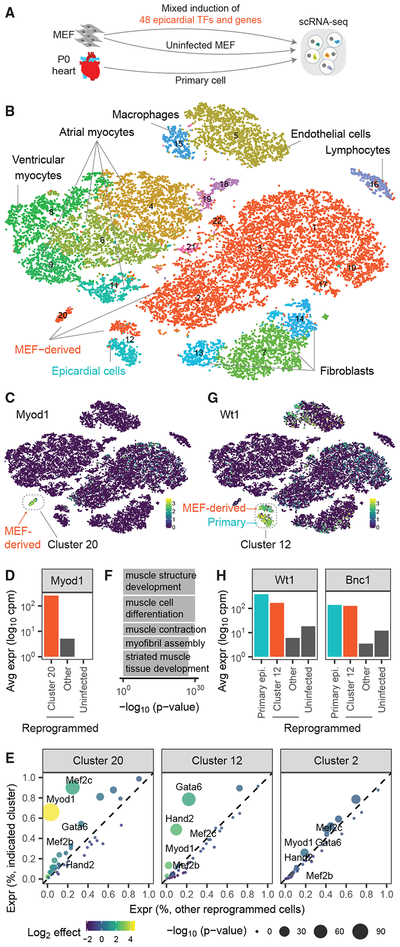
Figure 2. Application of Reprogram-Seq for Unbiased Reprogramming with 48 Factors.
(A) Experimental design. We performed scRNA-Seq on MEFs reprogrammed with 48F, uninfected MEFs, and primary P0 mouse heart cells.
(B) The 25,776 cells were clustered and plotted using t-distributed stochastic neighbor embedding (t-SNE; MEF-derived, red; primary cells, non-red).
(C) Heatmap of cells by Myod1 expression. MEF-derived cells and Cluster 20 are indicated.
(D) Expression of Myod1 in MEF-derived cells.
(E) Differential-expression analysis of 48F in MEF-derived clusters, as compared with all other reprogrammed cells. Each dot represents a gene (colored by fold change and sized by p value).
(F) Gene ontology analysis for genes differentially expressed in Cluster 20.
(G) Heatmap of cells by Wt1 expression. Indicated is Cluster 12, which consists of MEF-derived cells and primary cells.
(H) Expression of Wt1 and Bnc1 in MEF-derived cells.

