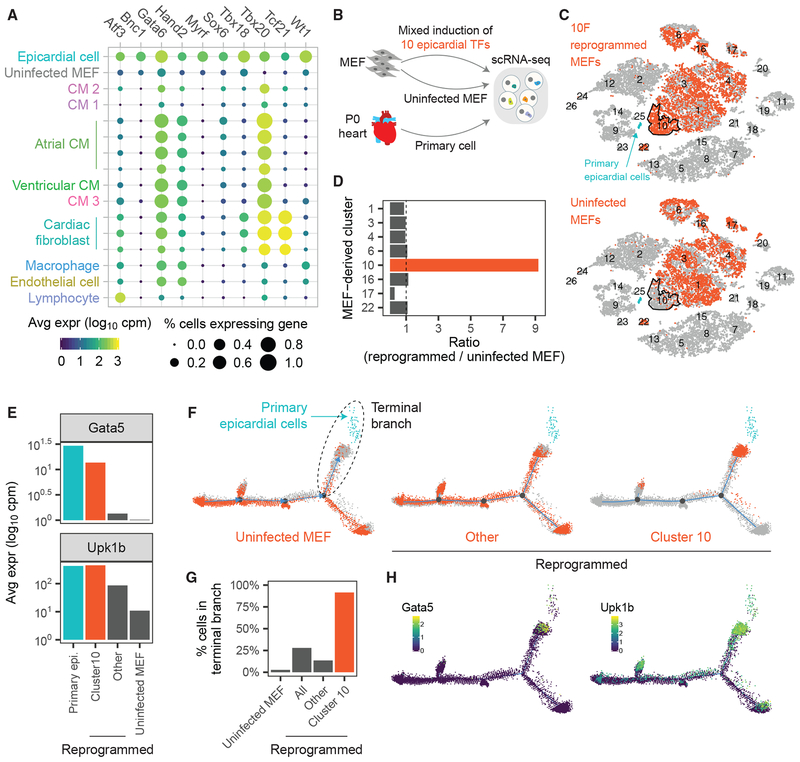
Figure 3. Application of Reprogram-Seq for Epicardial Reprogramming.
(A) We identified 10 TFs differentially expressed in primary epicardial cells compared with uninfected MEFs. Shown is the expression of 10F in MEFs and P0 mouse heart cells.
(B) Experimental design. We performed scRNA-Seq on MEFs reprogrammed with 10F, uninfected MEFs, and primary P0 mouse hearts.
(C) t-SNE plots consisting of all sequenced cells in (B). The 10F-reprogrammed MEFs (top) and uninfected MEFs (bottom) are colored orange. Primary epicardial cells are indicated in blue. Cluster 10 is outlined in black.
(D) Enrichment of reprogrammed MEFs compared with uninfected MEFs in different cell clusters.
(E) Expression of epicardial marker genes Gata5 and Upk1b in primary and MEF-derived cells.
(F) We performed pseudotime analysis on all MEF-derived cells and primary epicardial cells (blue). Uninfected MEFs (left), Cluster 10 reprogrammed cells (right), and other reprogrammed cells (middle) are indicated in orange.
(G) Bar chart indicating the percentage of cells in each group belonging to the terminal pseudotime branch (F).
(H) Heatmap of cells by (left) Gpm6a and (right) Upk1b expression.

