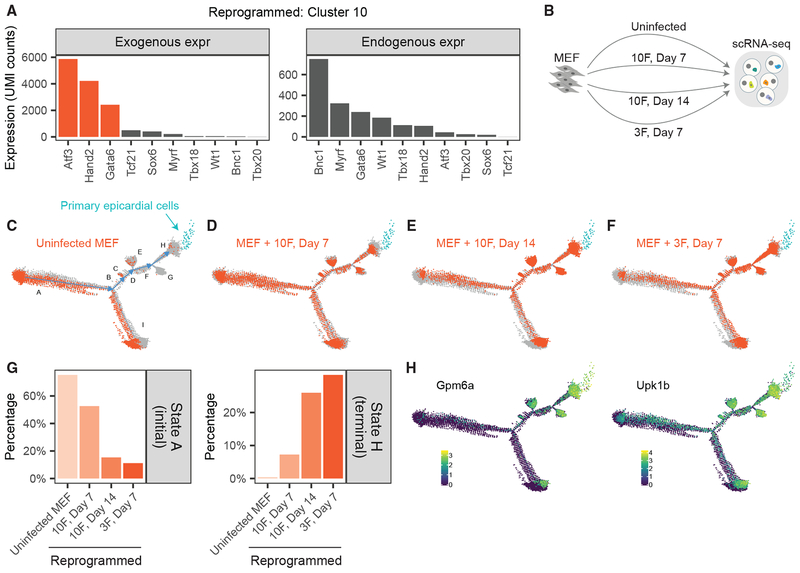
Figure 4. Optimized Epicardial Reprogramming with Atf3, Gata6, and Hand2.
(A) Estimates of exogenous and endogenous expression for 10F in Cluster 10 reprogrammed cells.
(B) Experimental design. We performed scRNA-Seq on uninfected MEFs and MEFs reprogrammed with 10F for 7 days, 10F for 14 days, and 3F for 7 days.
(C–F) We performed pseudotime analysis on the MEF-derived cells above and primary epicardial cells (blue). Indicated in orange are uninfected MEFs (C) and MEFs reprogrammed with 10F for 7 days (D), 10F for 14 days (E), and 3F for 7 days (F). States A–H of pseudotime are indicated in (C).
(G) Bar plot indicating the fraction of cells in each experiment that belong to the initial State A (left) or terminal State H (right) of pseudotime.
(H) Heatmap of cells by the expression of the epicardial marker gene Gpm6a (left) and Upk1b (right).

