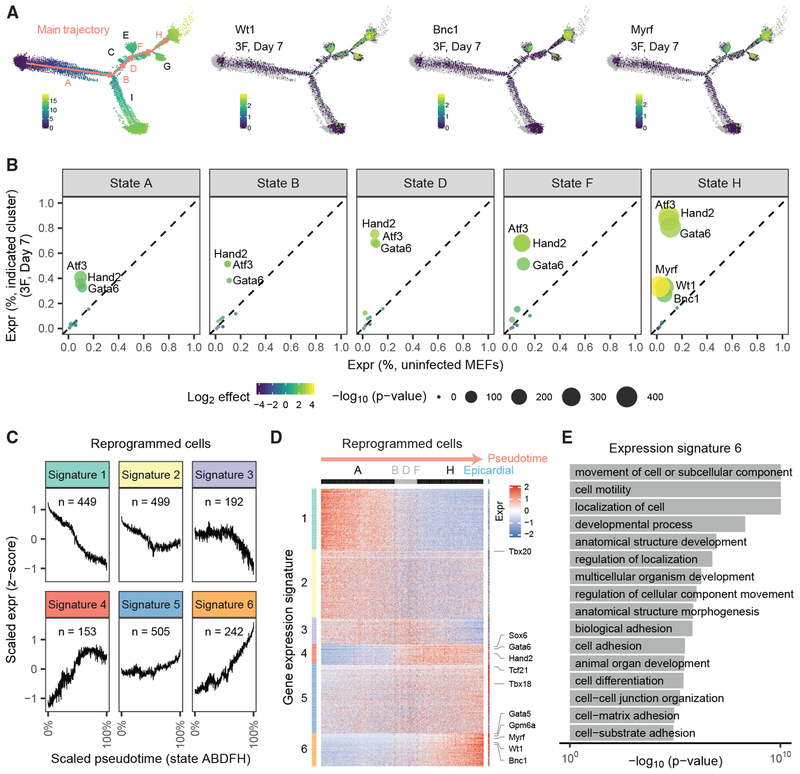
Figure 5. Atf3, Gata6, and Hand2 Activate the Epicardial Transcriptional Network.
(A) (left) The main trajectory of pseudotime is highlighted in orange. (middle-right) For MEFs reprogrammed with 3F for 7 days, we plot the expression of epicardial marker genes Wt1, Bnc1, and Myrf.
(B) Expression of exogenous genes (Atf3, Hand2, Gata6) and endogenous genes (Myrf, Wt1, Bnc1) across pseudotime states in MEFs reprogrammed with 3F for 7 days.
(C) We identified 2,040 genes differentially expressed between MEFs and primary epicardial cells. The genes cluster into six gene expression signatures during pseudotime. Expression is log10 transformed and Z normalized.
(D) Heatmap of the six gene-expression signatures. Columns indicate cells ordered by pseudotime (with primary epicardial cells at the far right); rows indicate genes. For visualization purposes, groups of 20 cells are binned.
(E) Gene ontology analysis of genes with expression Signature 6.

