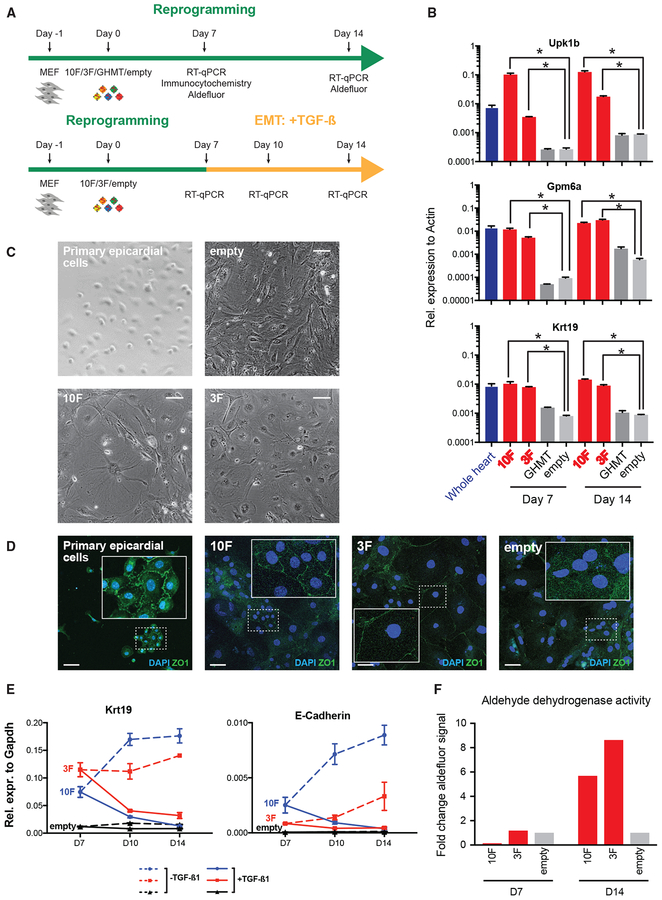
Figure 6. Functional Validation of Epicardial-like Reprogramming.
(A) Experimental design to functionally validate epicardial-like reprogramming.
(B) qRT-PCR analysis of epicardial markers (Upk1b, Gpm6a, Krt19) in reprogrammed MEFs (10F, 3F, and GHMT), negative-control-infected MEFs (empty vector), and whole mouse heart. Each bar shows the mean of three technical replicates. Error bars denote SEM.
(C) Phase contrast images of primary epicardial cells, uninfected MEFs, and reprogrammed MEFs. Scale bar indicates 100 microns.
(D) Immunocytochemistry with DAPI of ZO-1 in primary epicardial cells and reprogrammed MEFs. Insets: Zoomed-in views of example cells. Scale bar indicates 50 microns.
(E) qRT-PCR analysis of epithelial marker genes (Krt19 and E-Cadherin) during a time-course of EMT mediated by TGFß1 induction. Each bar shows the mean of three technical replicates. Error bars denote SEM.
(F) Aldehyde dehydrogenase activity of reprogrammed MEFs as measured by the Aldefluor assay.

