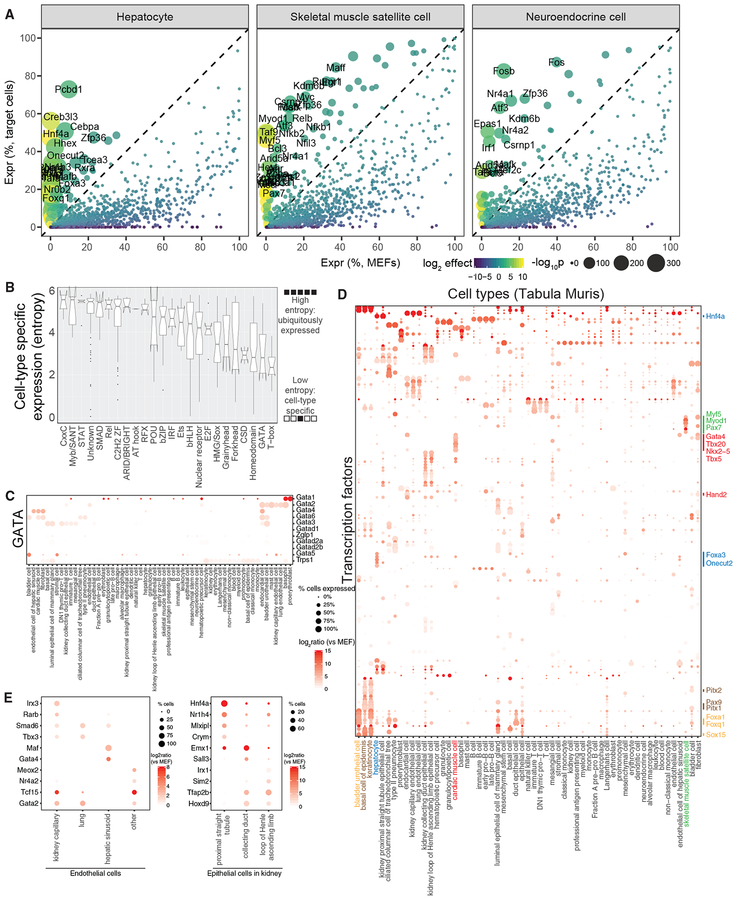
Figure 7. Predicting TF Cocktails to Reprogram Mouse Cell Types.
(A) Differential expression analysis of TFs in three primary mouse cell types (hepatocytes, skeletal muscle satellite cells, and neuroendocrine cells) defined by Tabula Muris, as compared with MEFs.
(B) Box plots indicating the cell-type-specific expression of TF families based on Shannon entropy.
(C) Dot plot indicating the expression of 11 TFs from the GATA family across the Tabula Muris cell types.
(D) Dot plot indicating the expression of 145 low-entropy TFs across cell types defined by the Tabula Muris.
(E) Dot plot of differentially expressed TFs for endothelial cells across four mouse organs (left) and three types of epithelial cells in mouse kidney (right).

