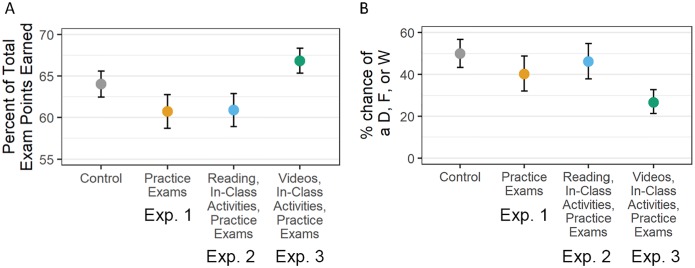
Fig 1. Students in Exp. 3 had increased exam performance and lower failure rates.
The data points are model-predicted average exam points earned on each exam (A) and percent chance of earning a D or F or withdrawing from the course (B) (S1 Data). Predictions are for students with average ACT scores in the study sample. Error bars represent the standard error around the estimate. Exp., experiment; W, withdrawal.

