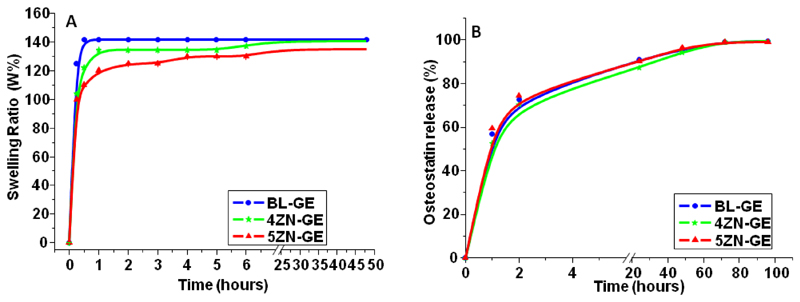
Figure 8.
(A) Swelling ratio (%W) of BL-GE, 4ZN-GE and 5ZN-GE scaffolds as a function of incubation time. (B) Osteostatin release from MBGs scaffolds between 1 h and 4 days in PBS. Points to trace the curves are the means of three independent measurements per time period. SEM values (representing a coefficient of variation of <5% for each point) are omitted for simplification.

