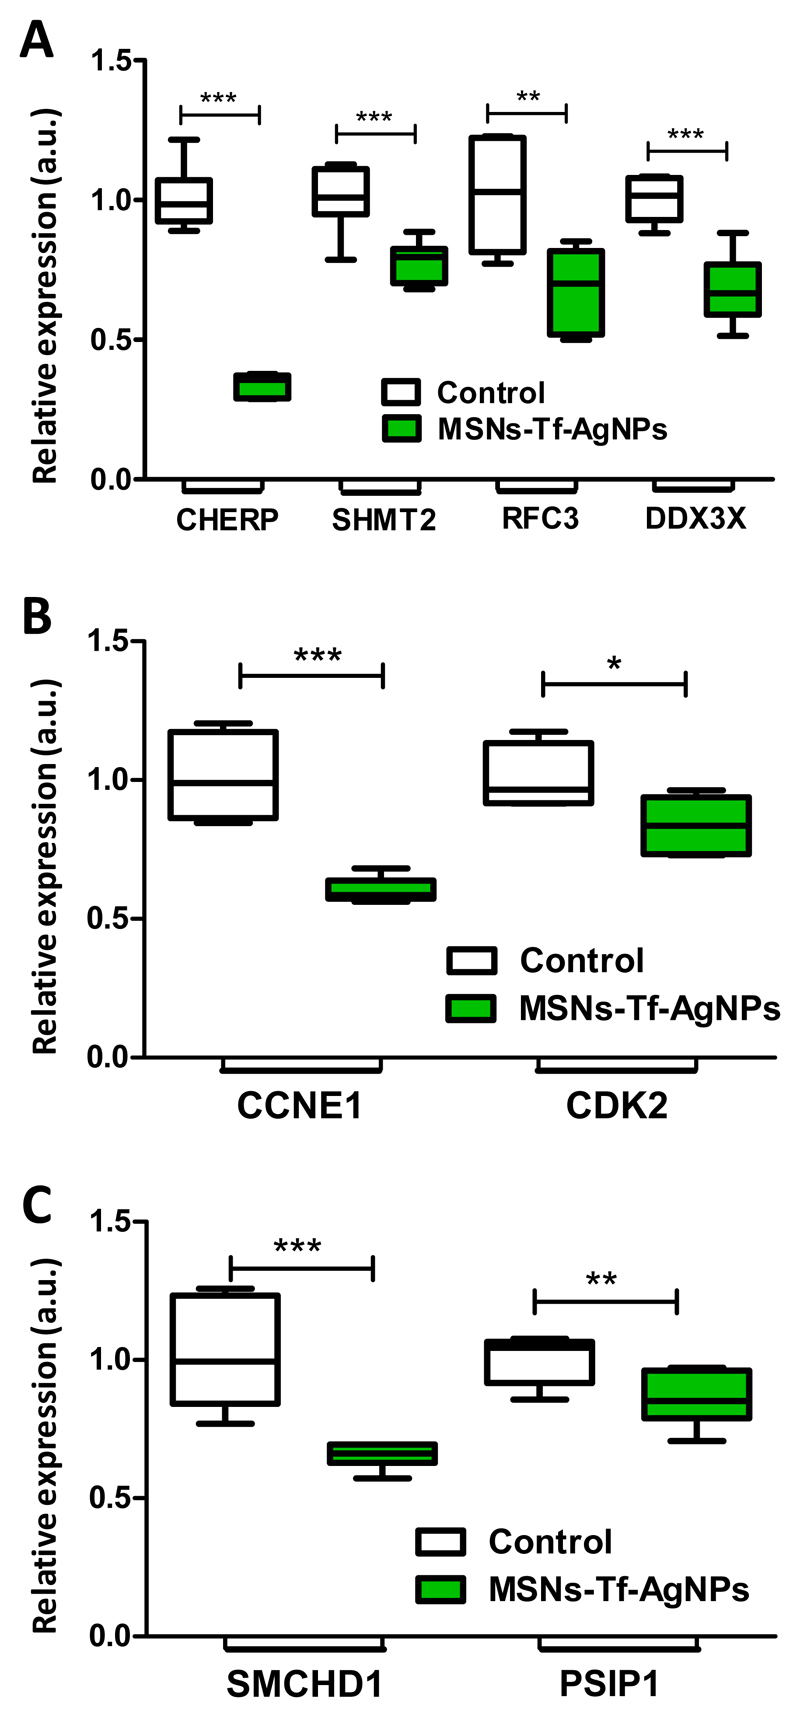
Figure 8.
A) Levels of mRNA of the different altered genes: CHERP, SHMT2, RFC3 and DDX3X. Statistical significance when compared to the control: **p<0.01 and ***p<0.001. B) Levels of mRNA of the proteins that form the G1/S transition regulatory complex (Cyclin E and Cdk2). Statistical significance when compared to the control: *p<0.05 and ***p<0.001. C) Levels of mRNA of SMCHD1 and PSIP1. Statistical significance when compared to the control: **p<0.01 and ***p<0.001.

