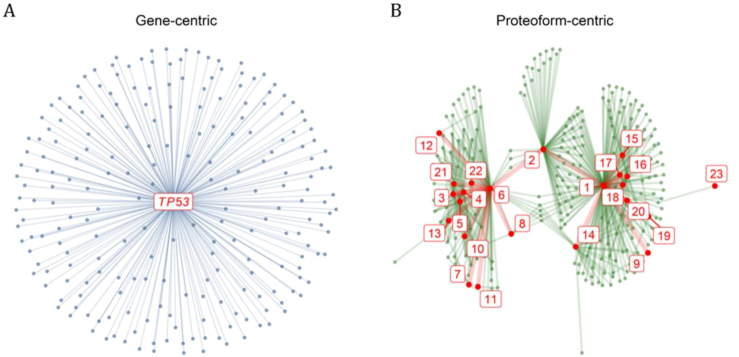
Figure 3.
Gene-centric versus proteoform-centric representation. (A) Graph representation of the genes involved in reactions (through their corresponding proteins) with (the corresponding proteins of) TP53, with a single node per gene. TP53 is represented with a red label at the center and genes coding proteins involved in reactions with TP53 are represented with smaller blue dots at the periphery connected to the TP53 gene with blue lines. (B) Graph representation of the proteins involved in a reaction with gene products of TP53, distinguishing isoforms and posttranslationally modified proteins as different proteoforms. The proteoforms coded by TP53 and the proteoforms involved in a reaction with them are represented with large red and small green dots, respectively. The proteoforms coded by TP53 are numbered according to Table 1. The connections between proteoforms coded by TP53 are displayed with thick red lines and connections with other proteoforms with thin green lines.

